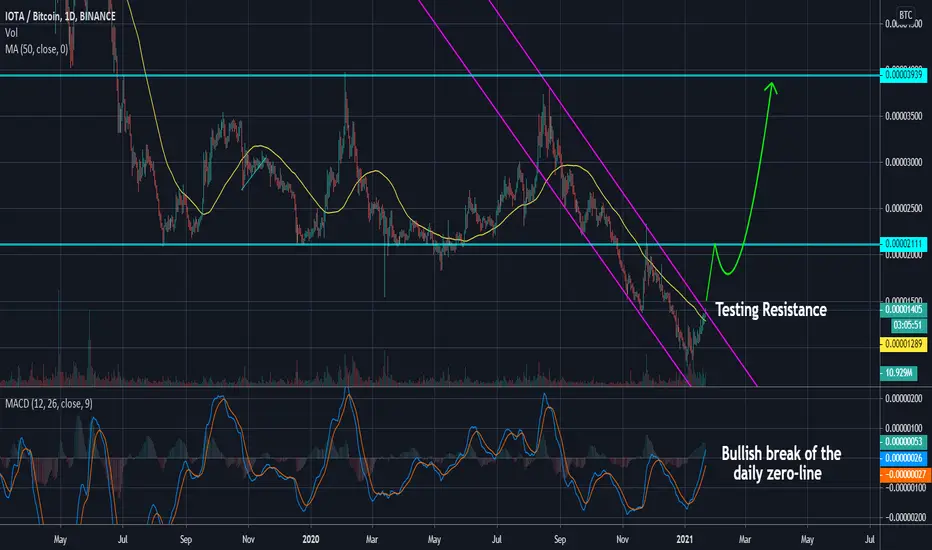
Take a quick look at the daily chart for IOTA/BTC. The price has been in a descending channel since August of 2020 and lost 79% of its value. But since then, the price action has shown a strong bullish reversal taking out the MA50 and is now testing resistance. If we can break out here, I could see the price jumping very quickly. The MACD has cleared the zero-line which is also bullish, especially on the daily time frame. Get ready!
ノート
免責事項
これらの情報および投稿は、TradingViewが提供または保証する金融、投資、取引、またはその他の種類のアドバイスや推奨を意図したものではなく、またそのようなものでもありません。詳しくは利用規約をご覧ください。
免責事項
これらの情報および投稿は、TradingViewが提供または保証する金融、投資、取引、またはその他の種類のアドバイスや推奨を意図したものではなく、またそのようなものでもありません。詳しくは利用規約をご覧ください。