On the Weekly chart I see excellent price divergence to the MACD indicator

On the daily chart there is also an excellent price divergence towards the indicator.

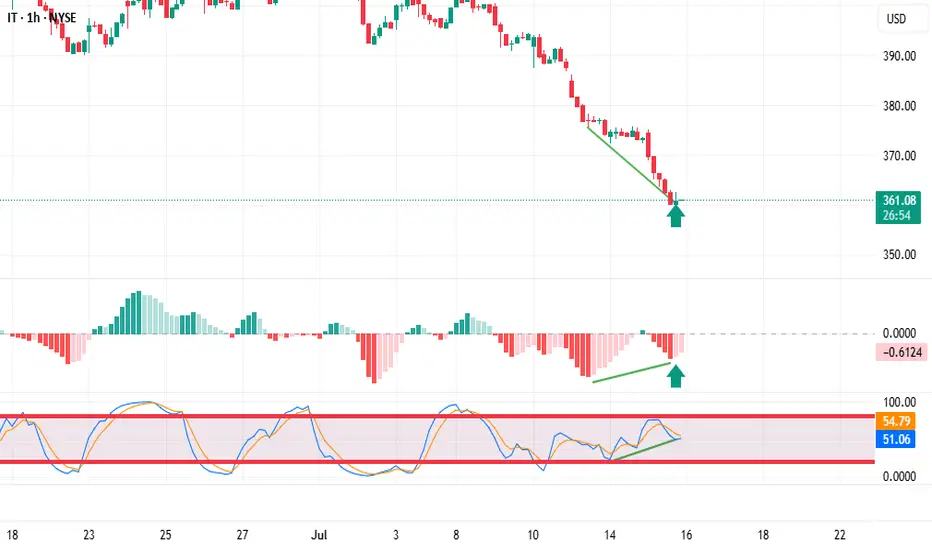
The hourly chart confirms the analysis; there is also a price divergence to the indicator.

The signal for me to enter a trade is that the histogram has stopped decreasing and changed the color of the bar from red to light pink
I placed a pending order above the bar marked with an arrow, and a stop loss below it.
 IT
IT
On the daily chart there is also an excellent price divergence towards the indicator.
The hourly chart confirms the analysis; there is also a price divergence to the indicator.
The signal for me to enter a trade is that the histogram has stopped decreasing and changed the color of the bar from red to light pink
I placed a pending order above the bar marked with an arrow, and a stop loss below it.
ノート
The price did not activate my buy order above the previous candle. Moved a buy order above the current barトレード稼働中
免責事項
これらの情報および投稿は、TradingViewが提供または保証する金融、投資、取引、またはその他の種類のアドバイスや推奨を意図したものではなく、またそのようなものでもありません。詳しくは利用規約をご覧ください。
免責事項
これらの情報および投稿は、TradingViewが提供または保証する金融、投資、取引、またはその他の種類のアドバイスや推奨を意図したものではなく、またそのようなものでもありません。詳しくは利用規約をご覧ください。