Overview of  IWM and the Russell 2000 Index
IWM is an exchange-traded fund (ETF) that tracks the Russell 2000 Index. According to Investopedia, the Russell 2000 is the most widely quoted measure of the overall performance of small-cap to mid-cap stocks. This index represents approximately 7% of the total market capitalization of the Russell 3000 and is composed of the bottom two-thirds of companies in terms of size within the Russell 3000 index. The broader Russell 3000 reflects the movements of nearly 96% of all publicly traded U.S. stocks.
Significance of IWM in Market Analysis
One of the reasons for focusing on this ETF is its role as a market barometer. IWM provides insight into whether small-cap stocks are participating in a broader bull market or lagging. Healthy bullish market continuations typically require participation from small-cap stocks. If small caps underperform, it may serve as an early warning that the overall market could be poised for a downturn, as these stocks are generally considered riskier.
Recent Technical Observations
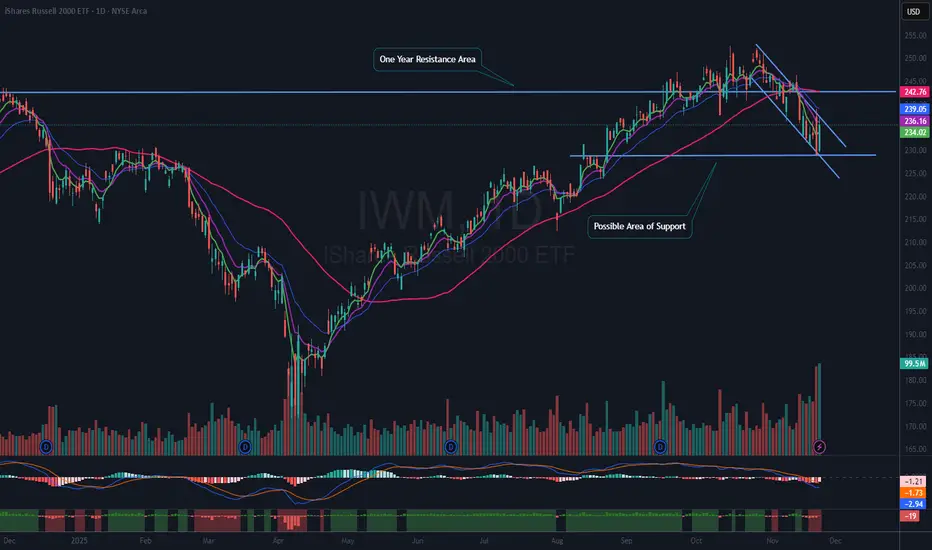
A review of the chart shows that from mid-September to mid-November, IWM has struggled to remain above a resistance area established one year ago. The ETF has declined about 8.5% from its recent highs and may be forming a flag pattern. There was a strong bounce on Friday, accompanied by heavy volume, but the price remains within the current downtrend.
It appears that IWM may have found support at a previous breakout level, though this is not yet confirmed. The ETF is currently trading well below both the 50-day moving average (red line) and the 21-day exponential moving average (blue line).
Potential Trade Considerations
A trade setup would be of interest if IWM can break above the downtrend line defining the flag pattern and regain the 21 EMA. Should this occur, waiting for the ETF to establish a higher low would provide an opportunity for a favorable risk-reward entry.
Conclusion and Cautions
At present, IWM does not offer a setup that fits the criteria for action within this trading strategy. Nevertheless, it may be worthwhile to add the ETF to a watchlist for future opportunities. All readers are encouraged to perform their own analysis and follow their personal trading rules. It is important to remember that all investments carry inherent risks, and making informed decisions is essential when allocating capital.
IWM is an exchange-traded fund (ETF) that tracks the Russell 2000 Index. According to Investopedia, the Russell 2000 is the most widely quoted measure of the overall performance of small-cap to mid-cap stocks. This index represents approximately 7% of the total market capitalization of the Russell 3000 and is composed of the bottom two-thirds of companies in terms of size within the Russell 3000 index. The broader Russell 3000 reflects the movements of nearly 96% of all publicly traded U.S. stocks.
Significance of IWM in Market Analysis
One of the reasons for focusing on this ETF is its role as a market barometer. IWM provides insight into whether small-cap stocks are participating in a broader bull market or lagging. Healthy bullish market continuations typically require participation from small-cap stocks. If small caps underperform, it may serve as an early warning that the overall market could be poised for a downturn, as these stocks are generally considered riskier.
Recent Technical Observations
A review of the chart shows that from mid-September to mid-November, IWM has struggled to remain above a resistance area established one year ago. The ETF has declined about 8.5% from its recent highs and may be forming a flag pattern. There was a strong bounce on Friday, accompanied by heavy volume, but the price remains within the current downtrend.
It appears that IWM may have found support at a previous breakout level, though this is not yet confirmed. The ETF is currently trading well below both the 50-day moving average (red line) and the 21-day exponential moving average (blue line).
Potential Trade Considerations
A trade setup would be of interest if IWM can break above the downtrend line defining the flag pattern and regain the 21 EMA. Should this occur, waiting for the ETF to establish a higher low would provide an opportunity for a favorable risk-reward entry.
Conclusion and Cautions
At present, IWM does not offer a setup that fits the criteria for action within this trading strategy. Nevertheless, it may be worthwhile to add the ETF to a watchlist for future opportunities. All readers are encouraged to perform their own analysis and follow their personal trading rules. It is important to remember that all investments carry inherent risks, and making informed decisions is essential when allocating capital.
Ideas I publish are my own. They are not meant to be investment / trading advice. You are encouraged to do your own due diligence.
I am under no obligation to post any action or update to any idea.
Follow me on "X" where I post more content.
I am under no obligation to post any action or update to any idea.
Follow me on "X" where I post more content.
免責事項
この情報および投稿は、TradingViewが提供または推奨する金融、投資、トレード、その他のアドバイスや推奨を意図するものではなく、それらを構成するものでもありません。詳細は利用規約をご覧ください。