Technical Analysis by Blaž Fabjan
Pattern Identification:
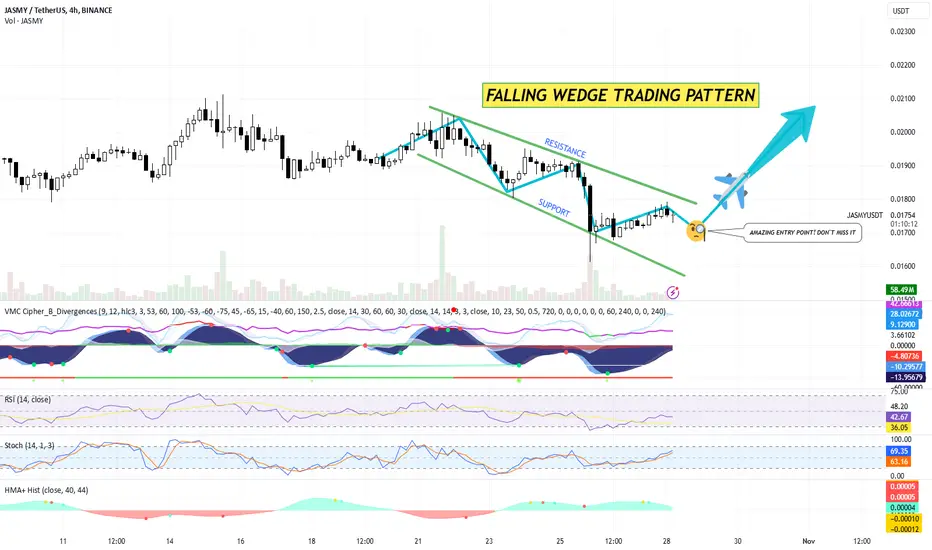
The chart displays a falling wedge pattern, a bullish reversal pattern often signifying a potential trend change from bearish to bullish.
The price action is currently testing the upper boundary of the wedge pattern, indicating that a breakout could be imminent if there’s sufficient buying momentum.
Support and Resistance:
Support Line: The lower green line in the falling wedge acts as support. This line has been consistently respected, indicating strong buying interest at those levels.
Resistance Line: The upper green line marks the resistance level within the pattern. A breakout above this line would be considered a strong bullish signal.
Volume Analysis:
There’s a noticeable decrease in volume within the wedge, which aligns with typical falling wedge characteristics. Look for a volume increase on a breakout to confirm the move.
Indicators:
VMC Cipher: Divergences and buy signals have been detected, showing signs of potential momentum shifts.
RSI: At around 41.07, the RSI is approaching the neutral zone (50), suggesting the potential for further upside if it breaks above 50.
Stochastic: Currently around 60.48, indicating upward momentum and possibly further bullish action if it continues moving up.
HMA+ Histogram: Showing minor bullish signals that could align with a breakout confirmation.
Entry Signal:
The wedge breakout zone is highlighted as an “Amazing Entry Point.” The suggested entry is around the resistance line in the pattern, currently close to $0.01743.
Trading Plan
Entry:
Enter a long position once JASMY/USDT breaks and closes above the falling wedge resistance line with increased volume. This would be near or slightly above the $0.0175 level, depending on price action confirmation.
Stop Loss:
Place a stop loss slightly below the wedge’s recent support level or just below the most recent swing low at around $0.016 to mitigate risk.
Take Profit Levels:
First Take Profit (TP1): Set around the recent swing high near $0.019.
Second Take Profit (TP2): For a more extended target, aim around $0.0205, where the price previously found resistance.
Final Take Profit (TP3): Around $0.022, aligning with previous higher resistance levels.
Risk Management:
Calculate position size to risk no more than 1-2% of your trading account per trade.
Monitor volume closely, as a breakout with low volume may indicate a false breakout, in which case exiting the trade early could be advisable.
Alternative Scenario:
If the price fails to break the resistance and moves back within the wedge, refrain from entering. In this case, wait for a possible retest of the support level around $0.016 as a secondary entry point.
Summary
Pattern: Falling Wedge (Bullish).
Buy Zone: Above $0.0175, confirmed with volume.
Stop Loss: Below $0.016.
Take Profit Targets: $0.019 (TP1), $0.0205 (TP2), $0.022 (TP3).
btw: VERY GOOD ENTRY POINT AT THE MOMENT!
Pattern Identification:
The chart displays a falling wedge pattern, a bullish reversal pattern often signifying a potential trend change from bearish to bullish.
The price action is currently testing the upper boundary of the wedge pattern, indicating that a breakout could be imminent if there’s sufficient buying momentum.
Support and Resistance:
Support Line: The lower green line in the falling wedge acts as support. This line has been consistently respected, indicating strong buying interest at those levels.
Resistance Line: The upper green line marks the resistance level within the pattern. A breakout above this line would be considered a strong bullish signal.
Volume Analysis:
There’s a noticeable decrease in volume within the wedge, which aligns with typical falling wedge characteristics. Look for a volume increase on a breakout to confirm the move.
Indicators:
VMC Cipher: Divergences and buy signals have been detected, showing signs of potential momentum shifts.
RSI: At around 41.07, the RSI is approaching the neutral zone (50), suggesting the potential for further upside if it breaks above 50.
Stochastic: Currently around 60.48, indicating upward momentum and possibly further bullish action if it continues moving up.
HMA+ Histogram: Showing minor bullish signals that could align with a breakout confirmation.
Entry Signal:
The wedge breakout zone is highlighted as an “Amazing Entry Point.” The suggested entry is around the resistance line in the pattern, currently close to $0.01743.
Trading Plan
Entry:
Enter a long position once JASMY/USDT breaks and closes above the falling wedge resistance line with increased volume. This would be near or slightly above the $0.0175 level, depending on price action confirmation.
Stop Loss:
Place a stop loss slightly below the wedge’s recent support level or just below the most recent swing low at around $0.016 to mitigate risk.
Take Profit Levels:
First Take Profit (TP1): Set around the recent swing high near $0.019.
Second Take Profit (TP2): For a more extended target, aim around $0.0205, where the price previously found resistance.
Final Take Profit (TP3): Around $0.022, aligning with previous higher resistance levels.
Risk Management:
Calculate position size to risk no more than 1-2% of your trading account per trade.
Monitor volume closely, as a breakout with low volume may indicate a false breakout, in which case exiting the trade early could be advisable.
Alternative Scenario:
If the price fails to break the resistance and moves back within the wedge, refrain from entering. In this case, wait for a possible retest of the support level around $0.016 as a secondary entry point.
Summary
Pattern: Falling Wedge (Bullish).
Buy Zone: Above $0.0175, confirmed with volume.
Stop Loss: Below $0.016.
Take Profit Targets: $0.019 (TP1), $0.0205 (TP2), $0.022 (TP3).
btw: VERY GOOD ENTRY POINT AT THE MOMENT!
免責事項
この情報および投稿は、TradingViewが提供または推奨する金融、投資、トレード、その他のアドバイスや推奨を意図するものではなく、それらを構成するものでもありません。詳細は利用規約をご覧ください。
免責事項
この情報および投稿は、TradingViewが提供または推奨する金融、投資、トレード、その他のアドバイスや推奨を意図するものではなく、それらを構成するものでもありません。詳細は利用規約をご覧ください。