Structure and Pattern Recognition
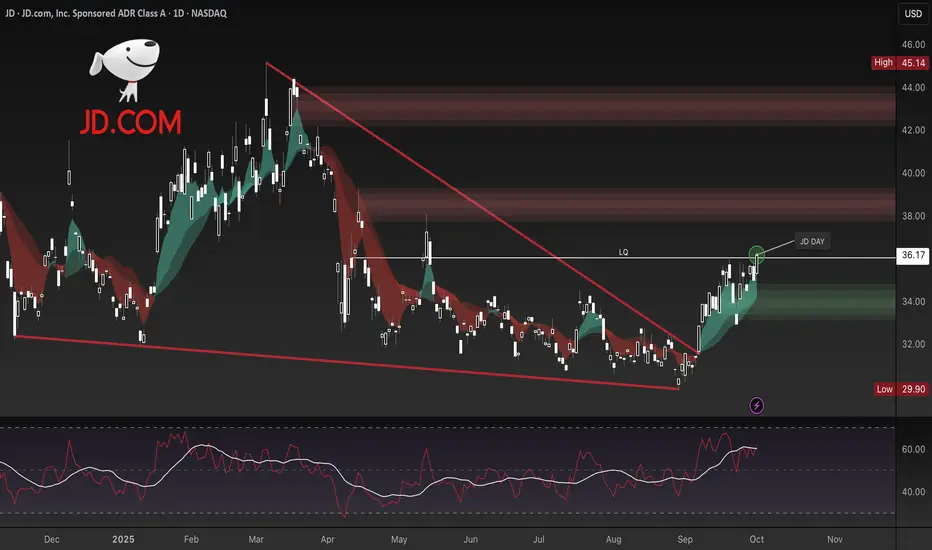
JD has recently broken out of a falling wedge structure, reclaiming strength after a prolonged downtrend. The breakout aligns with price now pressing against a key liquidity zone (LQ) near $36.00–$37.00, a level that previously capped multiple rally attempts. This breakout represents a meaningful shift in structure and suggests growing bullish momentum.
Key Catalyst – JD Day
The upcoming JD Day, one of the company’s largest annual sales and promotional events, often serves as a catalyst for both consumer activity and investor sentiment. Historically, this event has boosted short-term momentum as traders price in strong sales data and retail enthusiasm. With JD currently testing a breakout level, this fundamental catalyst could provide the spark needed to sustain upside continuation.
Key Levels and Setups
Current price sits at $36.17, directly testing resistance. A clean breakout above this level opens the door toward the next liquidity clusters around $39–$40 and potentially $42+ if momentum builds. Failure to hold above $35, however, risks a pullback into the $33–$34 demand zone before any sustained rally can take hold.
Volume and Momentum
Volume has been steadily increasing during the breakout, suggesting conviction behind the move. Momentum indicators remain supportive, with RSI holding strong near the upper mid-range without flashing overbought extremes. This indicates room for continuation if the catalyst delivers.
Outlook and Scenarios
Bullish Case: Break and hold above $36–$37 during JD Day would validate the wedge breakout, targeting $39–$42 in the near term.
Bearish Case: Failure to break above $36 or a rejection post-event could lead to a retracement back into $33–$34, with risk of retesting $30 if momentum fades.
Conclusion
JD is entering JD Day at a critical technical juncture. The breakout from a falling wedge provides a constructive base, while the event itself could act as a near-term catalyst to push price into higher supply zones. Traders should monitor the $36–$37 level closely, as it will likely dictate the next major leg of movement.
免責事項
これらの情報および投稿は、TradingViewが提供または保証する金融、投資、取引、またはその他の種類のアドバイスや推奨を意図したものではなく、またそのようなものでもありません。詳しくは利用規約をご覧ください。
免責事項
これらの情報および投稿は、TradingViewが提供または保証する金融、投資、取引、またはその他の種類のアドバイスや推奨を意図したものではなく、またそのようなものでもありません。詳しくは利用規約をご覧ください。