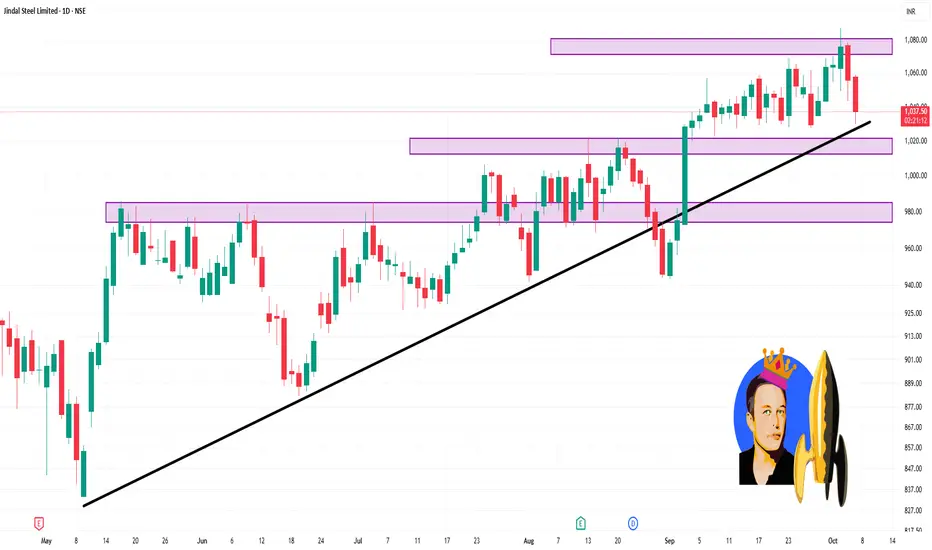
📈 Intraday Support & Resistance Levels
Resistance Levels:
₹1,078.87
₹1,071.93
₹1,063.47
Support Levels:
₹1,056.54
₹1,048.07
₹1,041.13
These levels are derived from pivot point calculations and are useful for short-term trading decisions.
🔍 Technical Indicators
Relative Strength Index (RSI): Currently at 39.78, indicating a bearish condition.
MACD: At -3.67, suggesting a bearish trend.
Moving Averages: The stock shows a strong sell outlook based on moving averages ranging from MA5 to MA200, with 2 buy signals and 10 sell signals.
関連の投稿
免責事項
これらの情報および投稿は、TradingViewが提供または保証する金融、投資、取引、またはその他の種類のアドバイスや推奨を意図したものではなく、またそのようなものでもありません。詳しくは利用規約をご覧ください。
関連の投稿
免責事項
これらの情報および投稿は、TradingViewが提供または保証する金融、投資、取引、またはその他の種類のアドバイスや推奨を意図したものではなく、またそのようなものでもありません。詳しくは利用規約をご覧ください。