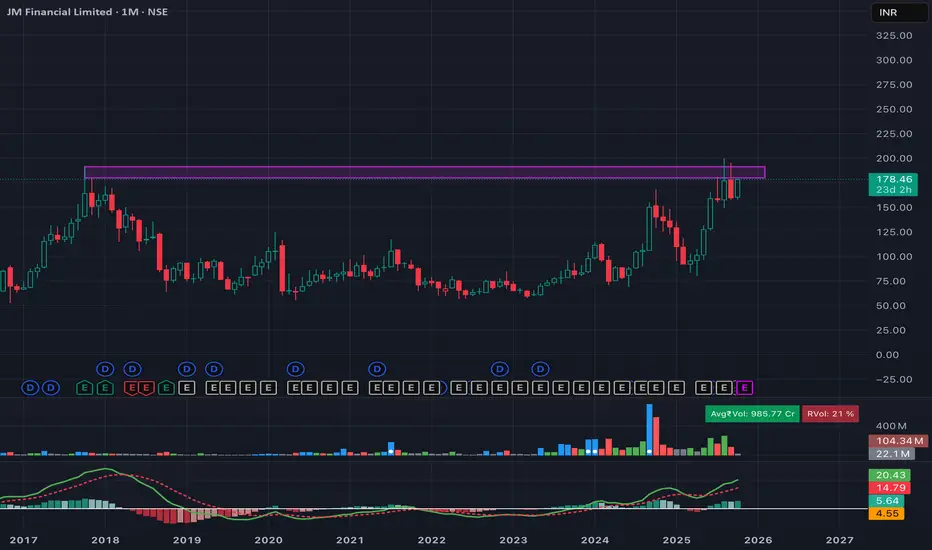
JM Financial is approaching a major breakout zone around ₹200, which has acted as a strong resistance for several years. The stock has built a solid base and is showing renewed momentum with strong monthly candle structure and improving volume.
If it manages to break and sustain above ₹200, it could mark the beginning of a long-term trend expansion phase. MACD is turning positive on higher timeframe — adding to the bullish setup.
📊 Positional Trade Plan
Entry: Above ₹200 (monthly closing or breakout confirmation)
Stop Loss (SL): 10% below entry or as per your risk
Target: 🎯 ₹300 (Long-term positional target)
View: A monthly close above ₹200 can trigger a strong multi-month breakout — ideal for investors with medium-to-long-term outlook.
免責事項
これらの情報および投稿は、TradingViewが提供または保証する金融、投資、取引、またはその他の種類のアドバイスや推奨を意図したものではなく、またそのようなものでもありません。詳しくは利用規約をご覧ください。
免責事項
これらの情報および投稿は、TradingViewが提供または保証する金融、投資、取引、またはその他の種類のアドバイスや推奨を意図したものではなく、またそのようなものでもありません。詳しくは利用規約をご覧ください。