A safe pair of hands. That’s what they tell me about JP Morgan. The chart says otherwise.
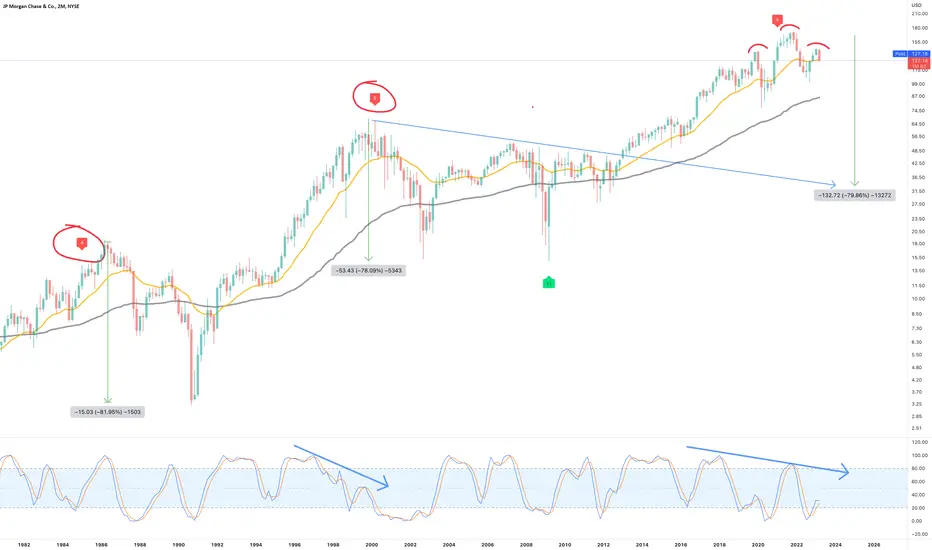
On the above 2-month chart a significant negative divergence has confirmed with price action. Looking left history tells us a correction of up to 80% follows with those powerful divergencies. A strong sell signal also printed on the chart similar to that in 1999 (not shown on chart).
Is it possible price action continues rising? Sure.
Is it probable? No.
Shall continue to study banks around the world to determine if this is a global issue or restricted to the USA. Indications at this time suggest the stress is restricted to American, Australia, & Swiss banks, I don’t know why. Remaining European banks do not appears to show the same bearishness.
Ww
トレード稼働中
To be a fly on the wall of those meetings during those forced takeovers. Don't worry, we've got leaked video..youtube.com/watch?v=QcoHpiiWc9Q
トレード稼働中
Price action has now broken out of the 2nd bear flag with two candle bodies from the 2-week chart.トレード稼働中
"Jamie Dimon to sell JPMorgan stock for first time"He's obviously a WW follower...
ft.com/content/8dfffd9b-3d9c-4819-a3df-9655f9888fac
2-week Gravestone DOJI
免責事項
これらの情報および投稿は、TradingViewが提供または保証する金融、投資、取引、またはその他の種類のアドバイスや推奨を意図したものではなく、またそのようなものでもありません。詳しくは利用規約をご覧ください。
免責事項
これらの情報および投稿は、TradingViewが提供または保証する金融、投資、取引、またはその他の種類のアドバイスや推奨を意図したものではなく、またそのようなものでもありません。詳しくは利用規約をご覧ください。