🔍 Fundamentals (from Screener & other sources)
Market Cap: ~ ₹69,000 Cr.
Revenue / Profit: Last reported revenue ~₹4,690 Cr, Profit ~₹1,614 Cr.
5-Yr Profit Growth: ~51.5% CAGR.
Valuation:
P/E is very high (in some sources ~186×) which suggests heavy premium pricing.
P/B ≈ 13.3×.
Returns: ROE ~14.5%, ROCE ~13.3%.
Dividend Yield: Very low (~0.24-0.3%) indicating most return is from capital appreciation.
Pros: Good profit growth, infrastructure tailwinds, improving operational metrics.
Cons: Rich valuation, high expectations priced in. Any weakness in cargo volumes or macro slowdown could hurt sentiment.
📈 Technical / Positional Setup
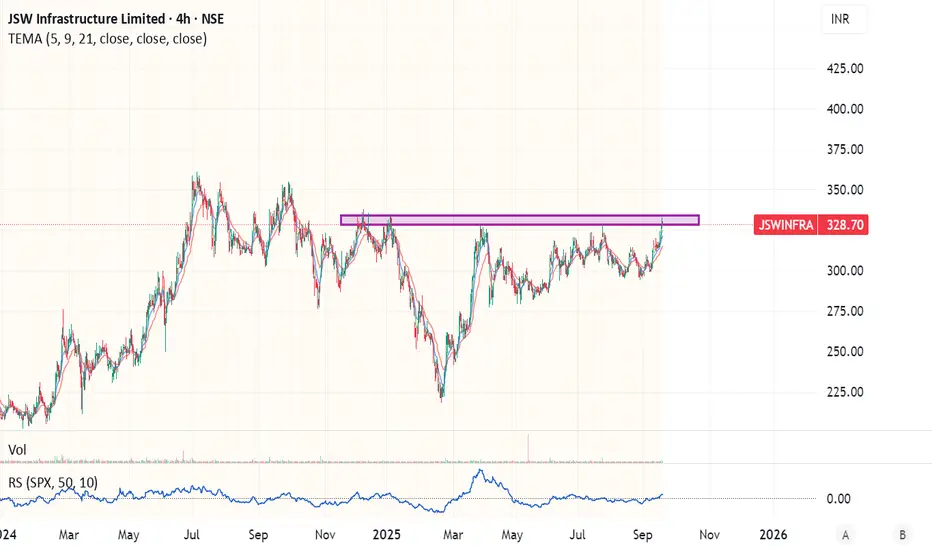
Based on the chart shared and corroborated with external technicals:
Resistance Zone: ~₹330-₹335 seems to be a critical resistance level (multiple past highs around that).
Support Zones: ~₹300-₹310 (recent pivot), deeper support around ₹280-₹290 if weakness.
Moving Averages: Short term EMAs seem aligned bullishly (from chart), price pushing above resistance, indicating breakout attempt.
Macd / Momentum: External sources show moving averages giving “Buy” signals; momentum indicators generally positive.
🎯 Trade Plan
Parameter Value
Entry On clean breakout above ~₹335 with confirmation (strong volume)
Stop-Loss Below support ~₹300 - ₹305 zone
Target 1 ~₹370-₹400 (next resistance zones)
Target 2 ~₹430-₹450 (extended if trend continues)
Risk Profile High: because valuation is stretched and driver (cargo volumes, infra spending) needs to sustain
Market Cap: ~ ₹69,000 Cr.
Revenue / Profit: Last reported revenue ~₹4,690 Cr, Profit ~₹1,614 Cr.
5-Yr Profit Growth: ~51.5% CAGR.
Valuation:
P/E is very high (in some sources ~186×) which suggests heavy premium pricing.
P/B ≈ 13.3×.
Returns: ROE ~14.5%, ROCE ~13.3%.
Dividend Yield: Very low (~0.24-0.3%) indicating most return is from capital appreciation.
Pros: Good profit growth, infrastructure tailwinds, improving operational metrics.
Cons: Rich valuation, high expectations priced in. Any weakness in cargo volumes or macro slowdown could hurt sentiment.
📈 Technical / Positional Setup
Based on the chart shared and corroborated with external technicals:
Resistance Zone: ~₹330-₹335 seems to be a critical resistance level (multiple past highs around that).
Support Zones: ~₹300-₹310 (recent pivot), deeper support around ₹280-₹290 if weakness.
Moving Averages: Short term EMAs seem aligned bullishly (from chart), price pushing above resistance, indicating breakout attempt.
Macd / Momentum: External sources show moving averages giving “Buy” signals; momentum indicators generally positive.
🎯 Trade Plan
Parameter Value
Entry On clean breakout above ~₹335 with confirmation (strong volume)
Stop-Loss Below support ~₹300 - ₹305 zone
Target 1 ~₹370-₹400 (next resistance zones)
Target 2 ~₹430-₹450 (extended if trend continues)
Risk Profile High: because valuation is stretched and driver (cargo volumes, infra spending) needs to sustain
免責事項
これらの情報および投稿は、TradingViewが提供または保証する金融、投資、取引、またはその他の種類のアドバイスや推奨を意図したものではなく、またそのようなものでもありません。詳しくは利用規約をご覧ください。
免責事項
これらの情報および投稿は、TradingViewが提供または保証する金融、投資、取引、またはその他の種類のアドバイスや推奨を意図したものではなく、またそのようなものでもありません。詳しくは利用規約をご覧ください。