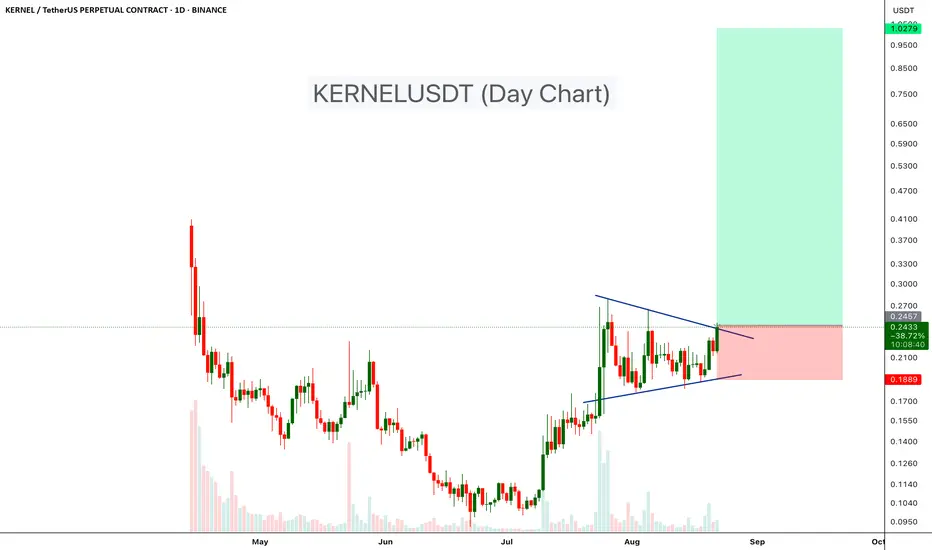
KERNELUSDT has been consolidating within a symmetrical triangle pattern on the daily chart, showing a battle between buyers and sellers after a strong uptrend. Recently, price has started breaking above the upper trendline, which could indicate the beginning of a fresh bullish move.
Pattern: Symmetrical Triangle
Entry Zone: Around current breakout levels (~0.24–0.25 USDT)
Target Zone: $0.5 - $1.00
Stop-Loss: Below 0.19 USDT (recent support)
Cheers
Hexa
Pattern: Symmetrical Triangle
Entry Zone: Around current breakout levels (~0.24–0.25 USDT)
Target Zone: $0.5 - $1.00
Stop-Loss: Below 0.19 USDT (recent support)
Cheers
Hexa
🚀Telegram : t.me/hexatrades
🌐Website: hexatrades.io/
🗣️Twitter(X): twitter.com/HexaTrades
🌐Website: hexatrades.io/
🗣️Twitter(X): twitter.com/HexaTrades
関連の投稿
免責事項
これらの情報および投稿は、TradingViewが提供または保証する金融、投資、取引、またはその他の種類のアドバイスや推奨を意図したものではなく、またそのようなものでもありません。詳しくは利用規約をご覧ください。
🚀Telegram : t.me/hexatrades
🌐Website: hexatrades.io/
🗣️Twitter(X): twitter.com/HexaTrades
🌐Website: hexatrades.io/
🗣️Twitter(X): twitter.com/HexaTrades
関連の投稿
免責事項
これらの情報および投稿は、TradingViewが提供または保証する金融、投資、取引、またはその他の種類のアドバイスや推奨を意図したものではなく、またそのようなものでもありません。詳しくは利用規約をご覧ください。