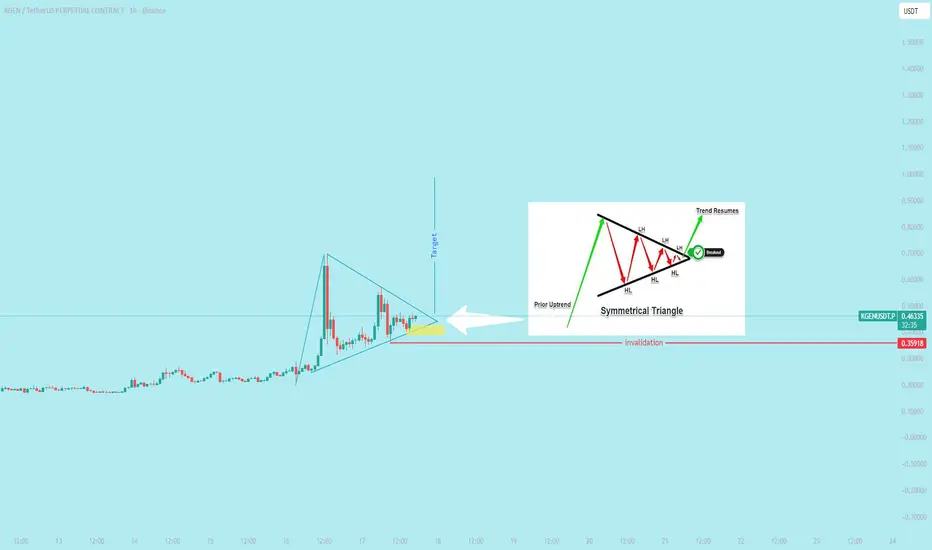
A bullish symmetrical triangle is a continuation pattern that signals a potential resumption of an uptrend. The pattern forms during a period of market indecision, where the price consolidates between a descending upper trendline and an ascending lower trendline. A confirmed breakout above the upper trendline suggests that buyers have regained control and the upward momentum is likely to continue.
免責事項
これらの情報および投稿は、TradingViewが提供または保証する金融、投資、取引、またはその他の種類のアドバイスや推奨を意図したものではなく、またそのようなものでもありません。詳しくは利用規約をご覧ください。
免責事項
これらの情報および投稿は、TradingViewが提供または保証する金融、投資、取引、またはその他の種類のアドバイスや推奨を意図したものではなく、またそのようなものでもありません。詳しくは利用規約をご覧ください。