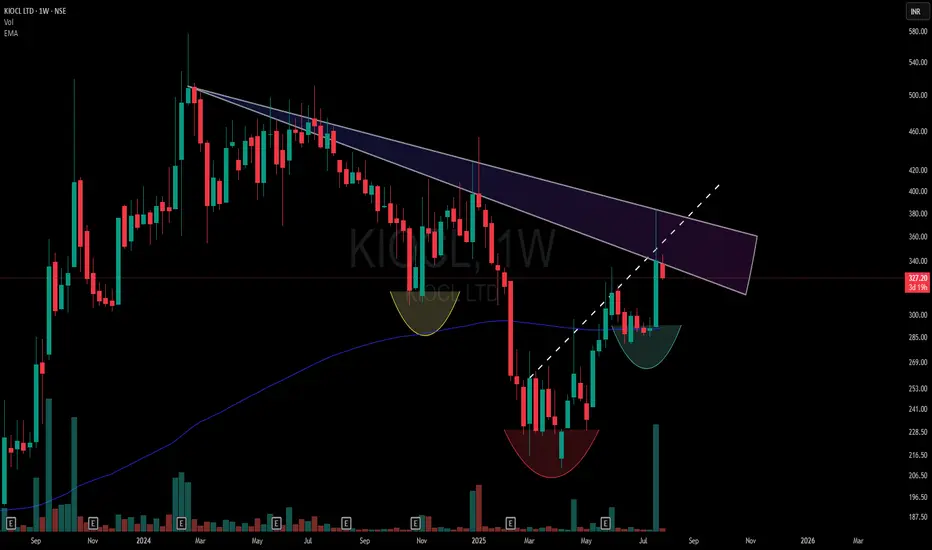
- This chart highlights a dual counter-trend resistance zone formed by two overlapping CT trendlines (marked in the shaded purple region).
🟡 Yellow Cup – Marks the origin base of the structure (assumed starting shift).
🔴 Red Cup – Establishes a Lower Low Base, still within bearish control.
🟢 Green Cup – Forms a Higher Low Base, showing a market structure change supported by a noticeable volume surge.
- The dotted trendline drawn through the zone acts as a hidden resistance confluence
⚠️ Disclaimer:
This post is non-forecasting in nature. It is not a buy/sell recommendation or financial advice. The chart is shared purely for educational and structural analysis purposes.
🎯 Master My Self-Made Trading Strategy
📈 Telegram (Learn Today): t.me/hashtaghammer
✅ WhatsApp (Learn Today): wa.me/919455664601
📈 Telegram (Learn Today): t.me/hashtaghammer
✅ WhatsApp (Learn Today): wa.me/919455664601
関連の投稿
免責事項
この情報および投稿は、TradingViewが提供または推奨する金融、投資、トレード、その他のアドバイスや推奨を意図するものではなく、それらを構成するものでもありません。詳細は利用規約をご覧ください。