KSM 1W chart has a Desending tringle pattern that has been broke
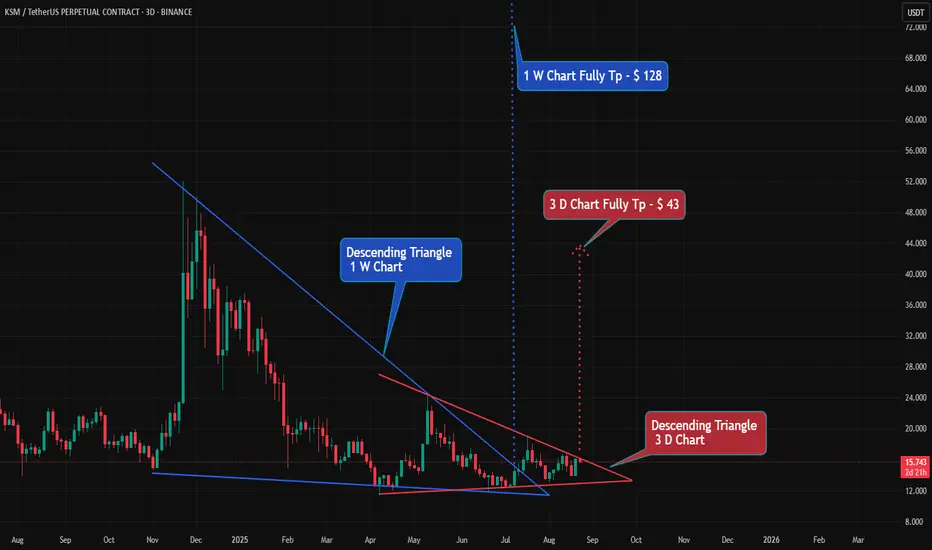
#KSM 1W chart has a Desending tringle pattern that has been broken. 🔼🔼
#KMS Coin is currently forming a Descending Triangle pattern on the 3D chart.
👀 When the market reaches the $723 level, 👀 it shows a double bottom pattern. If it also breaks out, it can rise to $1060.🔼
💵 Tp 1 : $ 443
💵 Tp 2 : $ 499
💵 Tp 3 : $ 575
💵 Tp 4 : $ 723
💵 Tp 5 : $ 1060
#KMS Coin is currently forming a Descending Triangle pattern on the 3D chart.
👀 When the market reaches the $723 level, 👀 it shows a double bottom pattern. If it also breaks out, it can rise to $1060.🔼
💵 Tp 1 : $ 443
💵 Tp 2 : $ 499
💵 Tp 3 : $ 575
💵 Tp 4 : $ 723
💵 Tp 5 : $ 1060
免責事項
この情報および投稿は、TradingViewが提供または推奨する金融、投資、トレード、その他のアドバイスや推奨を意図するものではなく、それらを構成するものでもありません。詳細は利用規約をご覧ください。
免責事項
この情報および投稿は、TradingViewが提供または推奨する金融、投資、トレード、その他のアドバイスや推奨を意図するものではなく、それらを構成するものでもありません。詳細は利用規約をご覧ください。