ANALYSIS 🔎
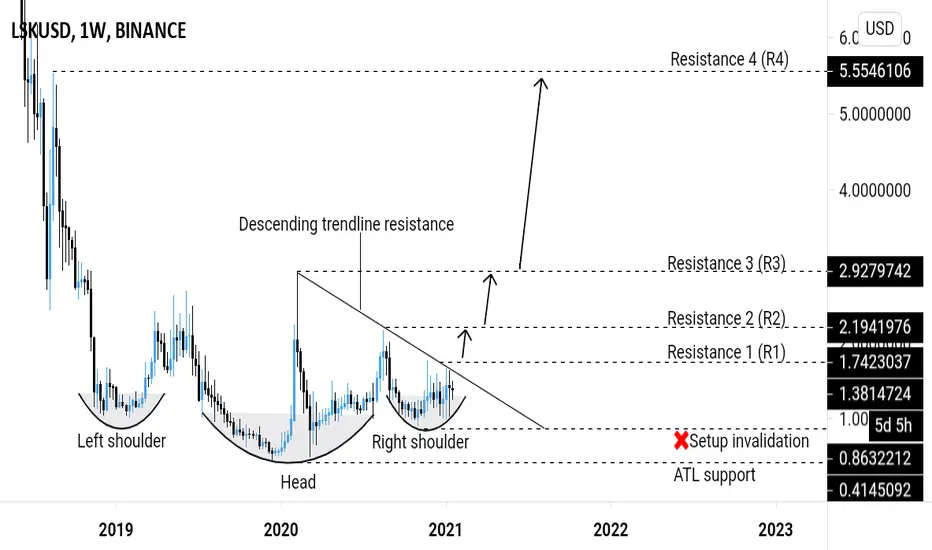
- LSKUSD is printing the inverse head and shoulders trend reversal pattern on the weekly timeframe. This is a bullish pattern.
- Price has been resisted by a descending trendline resistance since February 2020.
- There's is a breakout potential.
BUY ENTRY ⬆️
- Breakout above the descending trendline resistance and resistance 1 (R1).
TARGETS 🎯
- Horizontal resistance levels (R2, R3, R4).
SETUP INVALIDATION ❌
- Breakdown below the right shoulder support level.
免責事項
これらの情報および投稿は、TradingViewが提供または保証する金融、投資、取引、またはその他の種類のアドバイスや推奨を意図したものではなく、またそのようなものでもありません。詳しくは利用規約をご覧ください。
免責事項
これらの情報および投稿は、TradingViewが提供または保証する金融、投資、取引、またはその他の種類のアドバイスや推奨を意図したものではなく、またそのようなものでもありません。詳しくは利用規約をご覧ください。