📉 Mahindra & Mahindra – Bearish Setup Analysis
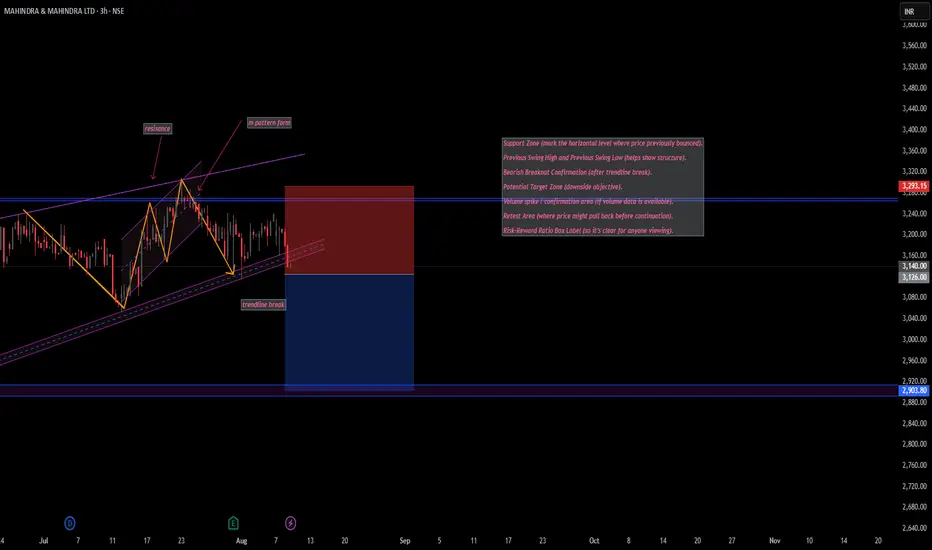
Pattern Formation: A clear M pattern has formed near the major resistance zone around ₹3,293, indicating potential trend exhaustion.
Trendline Break: Price has decisively broken the rising trendline, signaling a shift from bullish to bearish momentum.
Support Zone: Next strong support lies near ₹2,903, which is also the target zone based on the M pattern breakdown.
Risk–Reward: Short entry considered around ₹3,140 with stop-loss above ₹3,293 (resistance zone) and target near ₹2,903 offers a favorable R:R setup.
Market Structure: Recent lower highs and lower lows after the M pattern support the bearish bias.
Confirmation: Watch for a possible pullback/retest towards the broken trendline before further downside movement.
Summary:
If the breakdown sustains below the trendline, M&M could see further downside towards ₹2,903. A failed breakdown (price closing back above ₹3,200) would invalidate this bearish setup.
免責事項
この情報および投稿は、TradingViewが提供または推奨する金融、投資、トレード、その他のアドバイスや推奨を意図するものではなく、それらを構成するものでもありません。詳細は利用規約をご覧ください。
免責事項
この情報および投稿は、TradingViewが提供または推奨する金融、投資、トレード、その他のアドバイスや推奨を意図するものではなく、それらを構成するものでもありません。詳細は利用規約をご覧ください。