📊 M&M – Technical & Educational Snapshot
Ticker: NSE: M&M | Sector: 🚙 Auto
CMP: ₹2,7XX (as of 16 Aug 2025)
Rating (for learning purpose): ⭐⭐⭐⭐
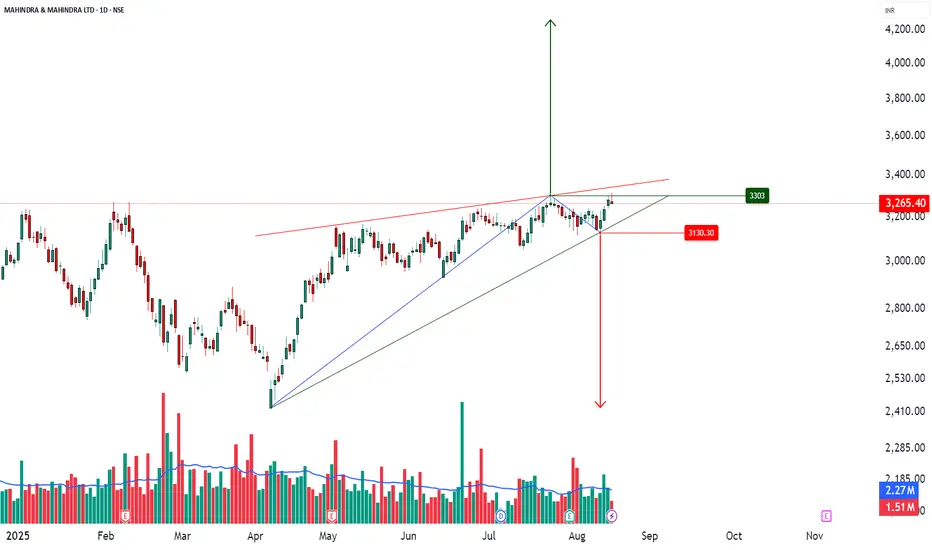
Pattern Observed: 📉 Rising Wedge Formation (Bearish Reversal Case Study)
🔑 Key Reference Levels (For Learning)
Support / Breakdown Zone: Lower wedge trendline
Resistance / Rejection Zone: Upper wedge trendline
Bearish Projection (Case Study): ~₹2,410
Bullish Continuation (Alternative View): ~₹3,300
📌 Pattern Observations
✅ Price forming higher highs & higher lows but within converging trendlines
✅ Momentum slowing → smaller swings inside wedge
✅ Typical bearish reversal structure (confirmation needed)
✅ Volume + RSI divergence can add conviction
📝 STWP Trade Analysis (Educational Illustration Only)
1️⃣ Bearish Breakdown (Primary Scenario)
Observation: Breakdown below wedge support often studied as bearish signal
Stop Loss (Learning Reference): Above upper wedge / recent swing high
Downside potential: ₹2,410 (measured move projection)
2️⃣ Bullish Breakout (Alternative Scenario)
Observation: Breakout above wedge resistance may lead to continuation
Stop Loss (Learning Reference): Below wedge / recent swing low
Upside potential: ₹3,300
📊 Risk Management & Confirmation
Traders typically wait for daily close outside wedge boundaries
Volume confirmation is key → spikes above average strengthen the move
RSI divergence often adds confidence to the setup
📌 Summary (Learning View Only)
The M&M Rising Wedge is a classic reversal study.
Key lesson: A wedge pattern teaches how slowing momentum can shift market control — but confirmation with volume + price close is essential before validating either direction.
⚠️ Disclaimer – Please Read Carefully
The information shared here is meant purely for learning and awareness. It is not a buy or sell recommendation and should not be taken as investment advice. I am not a SEBI-registered investment advisor, and all views expressed are based on personal study, chart patterns, and publicly available market data.
Trading — whether in stocks or options — carries risk. Markets can move unexpectedly, and losses can sometimes be larger than the money you have invested. Past performance or past setups do not guarantee future results.
If you are a beginner, treat this as a guide to understand how the market works — practice on paper trades before risking real money. If you are an experienced trader, remember to assess your own risk, position sizing, and strategy suitability before entering any trade.
Consult a SEBI-registered financial advisor before making any real trading decision.
By reading, watching, or engaging with this content, you acknowledge that you take full responsibility for your own trades and investments.
________________________________________
💬 Found this useful?
🔼 Give this post a Boost to help more traders discover clean, structured learning.
✍️ Drop your thoughts, questions, or setups in the comments — let’s grow together!
🔁 Share with fellow traders and beginners to spread awareness.
✅ Follow simpletradewithpatience for beginner-friendly setups, price action insights & disciplined trading content.
🚀 Stay Calm. Stay Clean. Trade With Patience.
Trade Smart | Learn Zones | Be Self-Reliant 📊
Ticker: NSE: M&M | Sector: 🚙 Auto
CMP: ₹2,7XX (as of 16 Aug 2025)
Rating (for learning purpose): ⭐⭐⭐⭐
Pattern Observed: 📉 Rising Wedge Formation (Bearish Reversal Case Study)
🔑 Key Reference Levels (For Learning)
Support / Breakdown Zone: Lower wedge trendline
Resistance / Rejection Zone: Upper wedge trendline
Bearish Projection (Case Study): ~₹2,410
Bullish Continuation (Alternative View): ~₹3,300
📌 Pattern Observations
✅ Price forming higher highs & higher lows but within converging trendlines
✅ Momentum slowing → smaller swings inside wedge
✅ Typical bearish reversal structure (confirmation needed)
✅ Volume + RSI divergence can add conviction
📝 STWP Trade Analysis (Educational Illustration Only)
1️⃣ Bearish Breakdown (Primary Scenario)
Observation: Breakdown below wedge support often studied as bearish signal
Stop Loss (Learning Reference): Above upper wedge / recent swing high
Downside potential: ₹2,410 (measured move projection)
2️⃣ Bullish Breakout (Alternative Scenario)
Observation: Breakout above wedge resistance may lead to continuation
Stop Loss (Learning Reference): Below wedge / recent swing low
Upside potential: ₹3,300
📊 Risk Management & Confirmation
Traders typically wait for daily close outside wedge boundaries
Volume confirmation is key → spikes above average strengthen the move
RSI divergence often adds confidence to the setup
📌 Summary (Learning View Only)
The M&M Rising Wedge is a classic reversal study.
Key lesson: A wedge pattern teaches how slowing momentum can shift market control — but confirmation with volume + price close is essential before validating either direction.
⚠️ Disclaimer – Please Read Carefully
The information shared here is meant purely for learning and awareness. It is not a buy or sell recommendation and should not be taken as investment advice. I am not a SEBI-registered investment advisor, and all views expressed are based on personal study, chart patterns, and publicly available market data.
Trading — whether in stocks or options — carries risk. Markets can move unexpectedly, and losses can sometimes be larger than the money you have invested. Past performance or past setups do not guarantee future results.
If you are a beginner, treat this as a guide to understand how the market works — practice on paper trades before risking real money. If you are an experienced trader, remember to assess your own risk, position sizing, and strategy suitability before entering any trade.
Consult a SEBI-registered financial advisor before making any real trading decision.
By reading, watching, or engaging with this content, you acknowledge that you take full responsibility for your own trades and investments.
________________________________________
💬 Found this useful?
🔼 Give this post a Boost to help more traders discover clean, structured learning.
✍️ Drop your thoughts, questions, or setups in the comments — let’s grow together!
🔁 Share with fellow traders and beginners to spread awareness.
✅ Follow simpletradewithpatience for beginner-friendly setups, price action insights & disciplined trading content.
🚀 Stay Calm. Stay Clean. Trade With Patience.
Trade Smart | Learn Zones | Be Self-Reliant 📊
📊 STWP | Mentor | Demand & Supply Specialist
🎯 Helping you become a self-reliant & independent trader
🎓 Learn more: simpletradewithpatience.com
📲 WhatsApp: wa.me/919987567889
🔍 Trade with Clarity. Learn with Patience.
🎯 Helping you become a self-reliant & independent trader
🎓 Learn more: simpletradewithpatience.com
📲 WhatsApp: wa.me/919987567889
🔍 Trade with Clarity. Learn with Patience.
免責事項
これらの情報および投稿は、TradingViewが提供または保証する金融、投資、取引、またはその他の種類のアドバイスや推奨を意図したものではなく、またそのようなものでもありません。詳しくは利用規約をご覧ください。