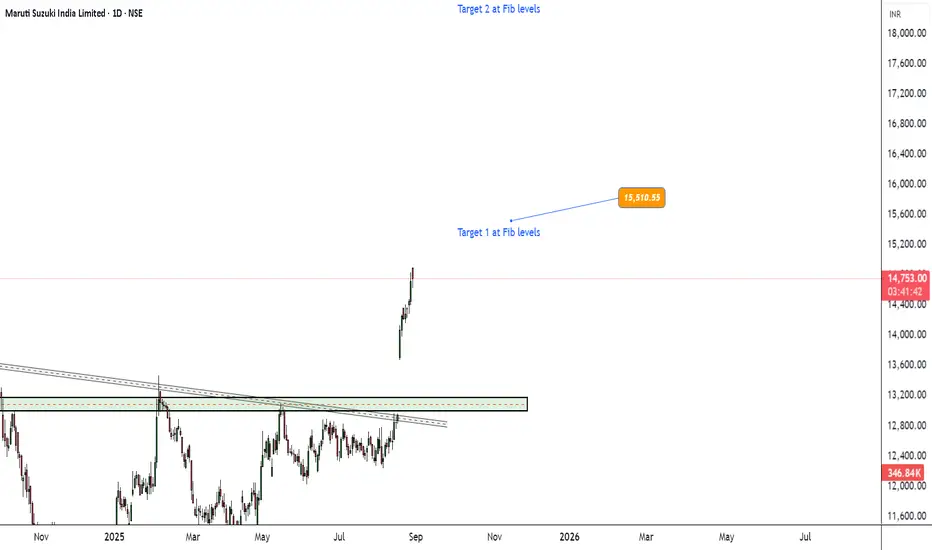
The Maruti Suzuki India Limited chart displays a strong upward trend with recent price action indicating a potential consolidation or pullback after a significant rally.
Technical indicators highlight important support and resistance levels, overall momentum.
Price Action & Trend
1.The price has recently surged from around ₹13,200 to a high of ₹14,754, reflecting a robust bullish move over the observed period.
2. Candlestick patterns show a sequence of higher highs and higher lows, typical of a sustained uptrend.
3. The current price is ₹14,749, slightly below the recent high, suggesting short-term profit booking or consolidation after an aggressive rally.
Volume & Signals
1.Volume has spiked during breakout points, providing confirmation for the bullish run. A recent decline in volume may suggest waning momentum or a period of consolidation.
2.The Stochastic or RSI-like oscillator is currently at 16.82, which is in the oversold territory. This could hint at an imminent reversal or a bounce if buyers regain control.
Buying Levels -
Above all time high and targets could be placed around 15,500 and 18,000.
#swingtrading
#volumeburst
#autosectorstocks
This is just a analysis and not to be considered as buy or sell. Do your analysis before taking any positions.
Happy trading.
トレード稼働中
Target 1 achieved. Now trailing can be done and hold till long term targets of 18500.免責事項
これらの情報および投稿は、TradingViewが提供または保証する金融、投資、取引、またはその他の種類のアドバイスや推奨を意図したものではなく、またそのようなものでもありません。詳しくは利用規約をご覧ください。
免責事項
これらの情報および投稿は、TradingViewが提供または保証する金融、投資、取引、またはその他の種類のアドバイスや推奨を意図したものではなく、またそのようなものでもありません。詳しくは利用規約をご覧ください。