$MICHI Set for 1400% Leap Amidst Historic Falling wedge Pattern
The Solana-based memecoin $MICHI is showing strong signs of a potential 1400% rally, with its price action forming a historic falling wedge pattern—a setup that has previously led to massive breakouts. As market conditions align for a bullish reversal, investors are keeping a close eye on $MICHI's next move.
Technical Analysis
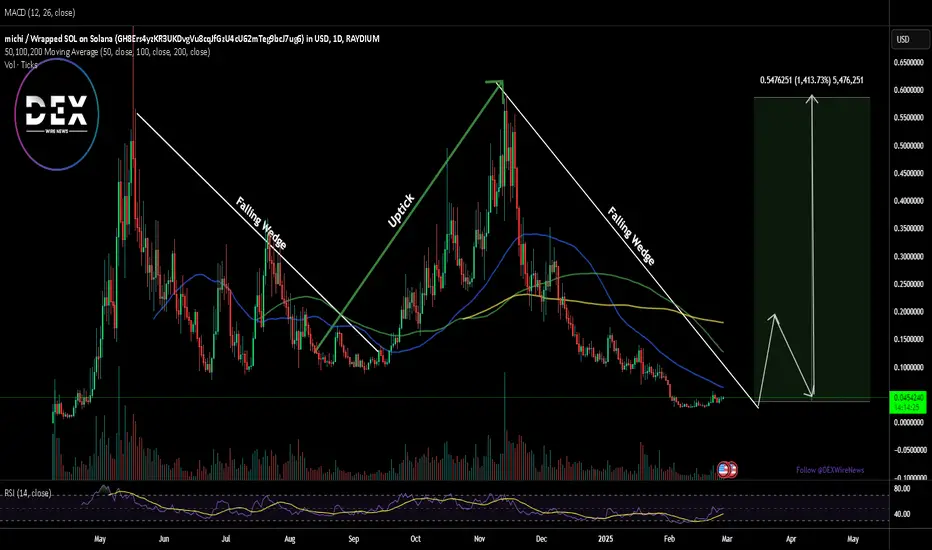
A falling wedge pattern is often a bullish reversal indicator, and $MICHI has repeatedly followed this pattern before making parabolic moves. Currently, the token is trading below key moving averages, creating room for a sharp recovery. With an RSI of 49.28, $MICHI is nearing neutral territory, indicating that selling pressure has eased, and a breakout could be imminent.
If this pattern plays out as expected, the memecoin could revisit its all-time high (ATH) of $0.57, marking a staggering 1400% surge from current levels.
Final Thoughts:
All indicators suggest that $MICHI is primed for a major move. With a well-established pattern, key technical indicators aligning, and strong fundamentals backing it, the stage is set for a potential bullish breakout. However, as always, traders should monitor key resistance levels and overall market sentiment before making a move.
Technical Analysis
A falling wedge pattern is often a bullish reversal indicator, and $MICHI has repeatedly followed this pattern before making parabolic moves. Currently, the token is trading below key moving averages, creating room for a sharp recovery. With an RSI of 49.28, $MICHI is nearing neutral territory, indicating that selling pressure has eased, and a breakout could be imminent.
If this pattern plays out as expected, the memecoin could revisit its all-time high (ATH) of $0.57, marking a staggering 1400% surge from current levels.
Final Thoughts:
All indicators suggest that $MICHI is primed for a major move. With a well-established pattern, key technical indicators aligning, and strong fundamentals backing it, the stage is set for a potential bullish breakout. However, as always, traders should monitor key resistance levels and overall market sentiment before making a move.
⭐⭐⭐ Sign Up for Free ⭐⭐⭐
1) Download our Mobile App >> link-to.app/dexwirenews
2) Join our Telegram >> t.me/DEXWireNews
3) Sign Up for Text Alerts >>
dexwirenews.com/TEXT
4) Follow @DEXWireNews on Social Media
1) Download our Mobile App >> link-to.app/dexwirenews
2) Join our Telegram >> t.me/DEXWireNews
3) Sign Up for Text Alerts >>
dexwirenews.com/TEXT
4) Follow @DEXWireNews on Social Media
免責事項
これらの情報および投稿は、TradingViewが提供または保証する金融、投資、取引、またはその他の種類のアドバイスや推奨を意図したものではなく、またそのようなものでもありません。詳しくは利用規約をご覧ください。