Market Outlook
The weekly chart remains in consolidation, with the daily chart revealing internal structure developing within a larger framework. Both buy-side and sell-side liquidity remain untapped. The most recent daily candle printed a doji, clearing prior liquidity and trading directly into a daily Optimal Trade Entry (OTE) zone — highlighting an area of interest for potential reversal.
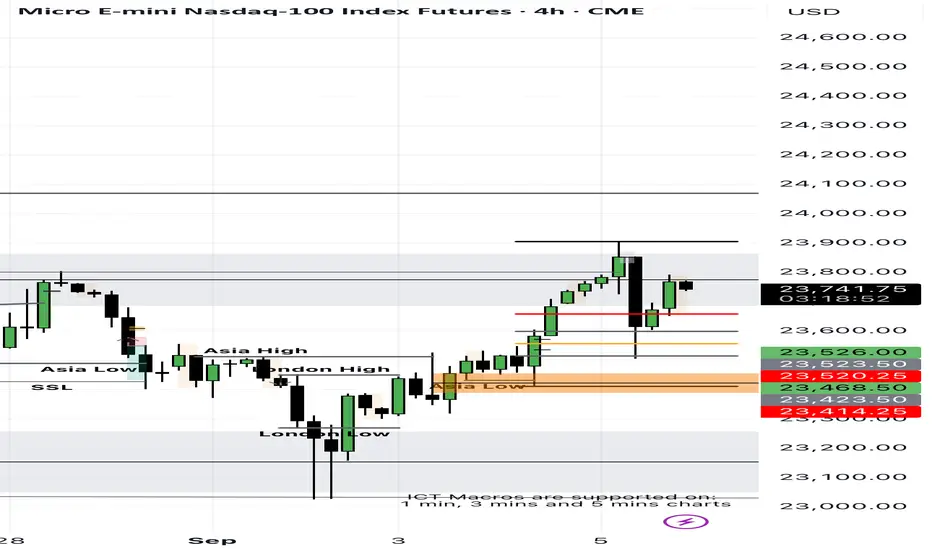
On the four-hour chart, clean sell-side liquidity is visible at 23,019, and the last four candles have established a bearish Fair Value Gap (FVG) within the daily OTE zone.
While the broader order flow still supports a buying program, my long-term bias is for a downside move. Until a valid reversal confirms, I will continue trading intraday longs. A shift to short setups will require the four-hour bearish FVG to hold and be validated as a point of resistance.
The weekly chart remains in consolidation, with the daily chart revealing internal structure developing within a larger framework. Both buy-side and sell-side liquidity remain untapped. The most recent daily candle printed a doji, clearing prior liquidity and trading directly into a daily Optimal Trade Entry (OTE) zone — highlighting an area of interest for potential reversal.
On the four-hour chart, clean sell-side liquidity is visible at 23,019, and the last four candles have established a bearish Fair Value Gap (FVG) within the daily OTE zone.
While the broader order flow still supports a buying program, my long-term bias is for a downside move. Until a valid reversal confirms, I will continue trading intraday longs. A shift to short setups will require the four-hour bearish FVG to hold and be validated as a point of resistance.
免責事項
これらの情報および投稿は、TradingViewが提供または保証する金融、投資、取引、またはその他の種類のアドバイスや推奨を意図したものではなく、またそのようなものでもありません。詳しくは利用規約をご覧ください。
免責事項
これらの情報および投稿は、TradingViewが提供または保証する金融、投資、取引、またはその他の種類のアドバイスや推奨を意図したものではなく、またそのようなものでもありません。詳しくは利用規約をご覧ください。