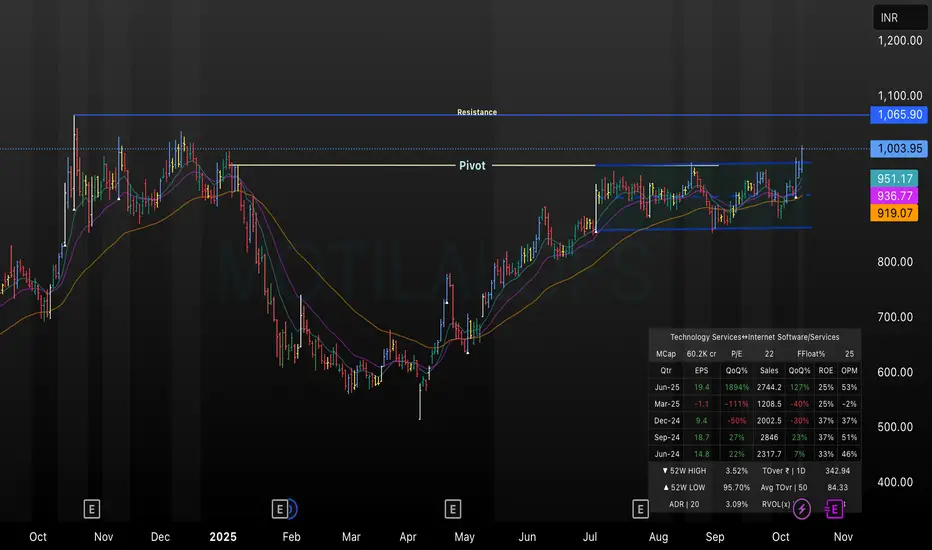
This TradingView chart for Motilal Oswal shows a clear price breakout above the key pivot level near ₹1,003.95, heading towards the marked resistance at ₹1,065.90. The chart uses daily candles and overlays short-to-medium-term EMAs, highlighting recent bullish momentum. The setup suggests a potential trend continuation if the resistance is breached, with all technicals and critical financial data displayed for context.
免責事項
この情報および投稿は、TradingViewが提供または推奨する金融、投資、トレード、その他のアドバイスや推奨を意図するものではなく、それらを構成するものでもありません。詳細は利用規約をご覧ください。
免責事項
この情報および投稿は、TradingViewが提供または推奨する金融、投資、トレード、その他のアドバイスや推奨を意図するものではなく、それらを構成するものでもありません。詳細は利用規約をご覧ください。