📌 To see my confluences and/or linework, step 1: grab chart, step 2: unhide Group 1 in object tree, step 3: hide and unhide specific confluences. 😊
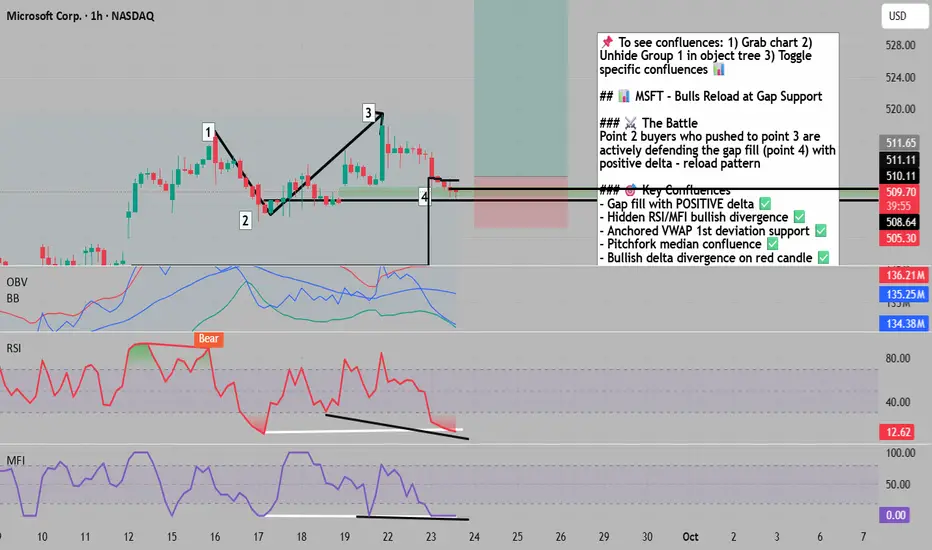
🎯 MSFT: Bulls Reload at Gap Fill - Spring Loads for Breakout
The Market Participant Battle:
The bulls who drove price from point 2 to point 3 have successfully defended their conviction zone at point 4 (the gap fill area). When point 3 closed above point 1, it validated point 2 buyers' strength. Now these same participants are reloading at their original entry zone with positive delta confirmation, setting up for another leg higher as buyers overwhelm sellers at this critical support level.
Confluences:
Confluence 1: Gap Fill Support with Positive Delta
The gap area at point 4 represents where buyers previously showed extreme conviction, creating upward price gaps to demonstrate urgency. Price has returned to this zone with POSITIVE volume delta, showing buyers are actively defending and accumulating at these levels. The Volume Footprint confirms buying dominance at this critical level, suggesting institutional accumulation rather than distribution.
Confluence 2: Hidden Bullish Divergence on RSI/MFI
Both RSI and MFI display hidden bullish divergences - price makes higher lows while indicators make lower lows. Additionally, both oscillators are oversold at the gap area (point 4), creating a second-degree layered bullish divergence. This technical setup typically precedes strong upward moves, particularly when occurring at historically significant price levels.
Confluence 3: Anchored VWAP Support Convergence
The anchored VWAP from point 1 brings point 4 precisely to the 1st standard deviation - a mathematically significant support level. This same reaction occurs when anchoring VWAP at the previous gap, suggesting algorithms and institutions are defending this price zone. The developing POC shows buyers stepping in below and then pushing price above, indicating active accumulation.
Confluence 4: Pitchfork Median Line Confluence
Anchoring the pitchfork at pivots 0, 1, and 2 creates a median line that intersects perfectly with the turning point where point 2 buyers defeated sellers from point 1. This geometric confluence at the gap fill zone suggests a high-probability bounce point.
Confluence 5: OBV Bollinger Band Extreme & Delta Divergence
The OBV touching the lower Bollinger Band extreme marks a capitulation point. Combined with the current candle showing bearish price action but BULLISH delta (buyers absorbing selling), this creates a powerful bullish divergence signal.
Web Research Findings:
- Technical Analysis: RSI at 64.861 suggests Buy signal, MACD at 2.850 indicates Buy
- Recent News/Earnings: Q4 earnings beat with $3.65 EPS vs $3.37 expected, revenue $76.44B vs $73.81B expected
- Analyst Sentiment: Average 12-month price target $625.78 with 20.82% upside potential
- Data Releases: Next earnings late October 2025
- Interest Rate Impact: Quarter-point Fed cut implemented with more cuts signaled for 2025
Layman's Summary:
Microsoft crushed earnings with AI and cloud revenue exploding. The stock pulled back to a key support level where big buyers previously showed strong interest (the gap). Now they're buying again at these levels (positive delta), while technical indicators are oversold and showing bullish divergences. With Fed rate cuts helping tech stocks and analysts targeting 20% upside, this looks like a solid reload opportunity.
Machine Derived Information:
- Image 1: Channel pattern with numbered reference points - Significance: Shows clear support test at gap fill area - AGREES ✔
- Image 2: Volume Footprint with positive delta at point 4 - Significance: Confirms buyer accumulation at gap support - AGREES ✔
- Images 3-6: Multiple timeframe confirmation - Significance: Consistent support holding around $509-510 gap zone - AGREES ✔
- Images 7-8: Moving average structure - Significance: Price testing key support with oversold bounce setup - AGREES ✔
- Images 9-10: Current consolidation - Significance: Bullish flag formation after support test - AGREES ✔
Actionable Machine Summary:
All machine-derived analysis confirms the bullish thesis. The gap fill area is holding with positive delta, multiple timeframes show support at this zone, and the consolidation pattern suggests accumulation before the next leg up. The combination of technical support, positive volume dynamics, and oversold indicators creates a high-probability long setup.
Conclusion:
Trade Prediction: SUCCESS
Confidence: High
The convergence of gap support with positive delta, multiple bullish divergences, and strong fundamental backdrop creates an excellent risk/reward setup. Machine analysis confirms buyer accumulation at these levels. Target the recent high at $518 initially, then $525-530 on a breakout. Stop loss below $508 for a favorable 3:1 risk/reward ratio.
for trading mentorship and community, message me on telegram : jacesabr_real
免責事項
これらの情報および投稿は、TradingViewが提供または保証する金融、投資、取引、またはその他の種類のアドバイスや推奨を意図したものではなく、またそのようなものでもありません。詳しくは利用規約をご覧ください。
for trading mentorship and community, message me on telegram : jacesabr_real
免責事項
これらの情報および投稿は、TradingViewが提供または保証する金融、投資、取引、またはその他の種類のアドバイスや推奨を意図したものではなく、またそのようなものでもありません。詳しくは利用規約をご覧ください。