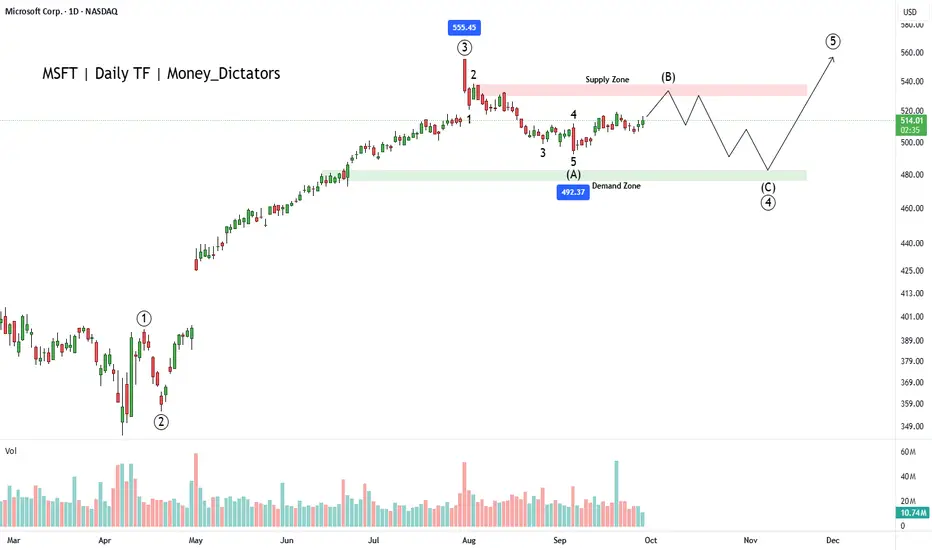
MSFT has bullish signals from the multiple moving averages, RSI and volume analysis. However, wave principle asks evidence from the buyers. The wave count suggests that the corrective wave (B) is ongoing, and bears will control the final wave of the primary wave 3.
Wave C will start falling nearby the supply zone and high of the 2nd wave of wave intermediate wave A. Wave C can fall up to 476 which will be the strength for wave primary wave 5. As per the chart, breakout above 540 will be a good signal for bulls to take charge back.
Zones:
Supply zone: 538 - 528
Demand zone: 482 - 476
I will update the chart and details shortly.
Life-time free telegram channel - t.me/moneydictators
関連の投稿
免責事項
これらの情報および投稿は、TradingViewが提供または保証する金融、投資、取引、またはその他の種類のアドバイスや推奨を意図したものではなく、またそのようなものでもありません。詳しくは利用規約をご覧ください。
Life-time free telegram channel - t.me/moneydictators
関連の投稿
免責事項
これらの情報および投稿は、TradingViewが提供または保証する金融、投資、取引、またはその他の種類のアドバイスや推奨を意図したものではなく、またそのようなものでもありません。詳しくは利用規約をご覧ください。