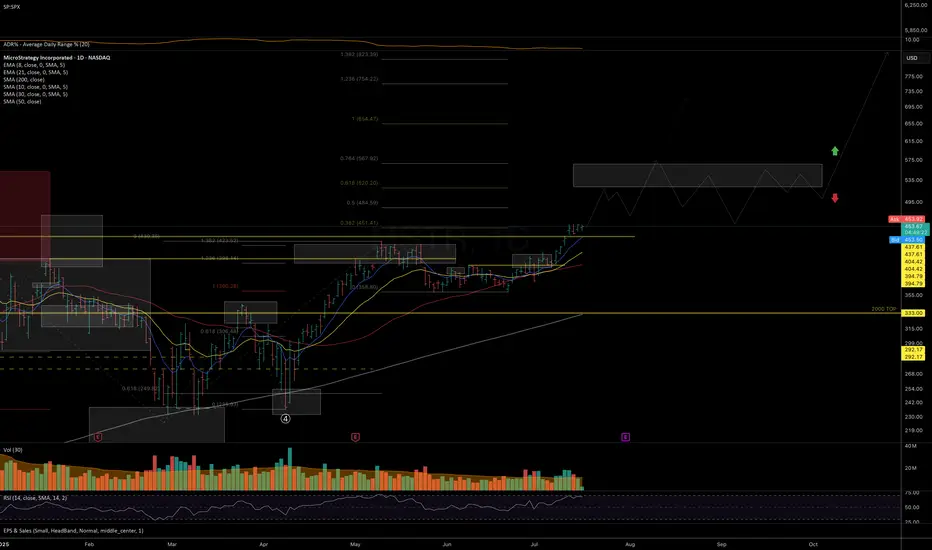
I was initially skeptical about the recovery structure unfolding since the April lows — it looked like a possible macro lower-high before deeper correction (as outlined in my previous idea).

However, given the strength in underlying #BTC price action (covered in my recent video-idea on crypto trend structure) and clear signs of constructive consolidation and accumulation during the July breakout, Isee strong odds for follow-through toward the 520–570 resistance zone in the coming weeks.

This move may align with BTC testing its macro resistance near 130K (see my macro BTC analysis on the idea section).
If MSTR can break above 570 and sustain a close above it, it opens the door to a potential immediate follow-through toward the 650–755 macro resistance zone. But a scenario for more prolonged consolidation around 570 would in fact serve as a solid base for more stable and prolonged next long-term leg higher.
However, given the strength in underlying #BTC price action (covered in my recent video-idea on crypto trend structure) and clear signs of constructive consolidation and accumulation during the July breakout, Isee strong odds for follow-through toward the 520–570 resistance zone in the coming weeks.
This move may align with
If
トレード稼働中
Price failed to hold the local support and moved into a deeper pullback, testing the lower end of the mid-term support zone of the uptrend since the June lows.Chart:
As long as the price holds above the 424–421 support, I maintain the uptrend structure outlined in the original idea as my primary scenario, with higher resistance targets expected in the coming weeks.
However, a break below this zone - but still holding above the July breakout support - would shift probabilities toward a still bullish, but less aggressive upside scenario, with potential for a sharp reversal (as an ending diagonal in yellow scenario).
Side note: The stock has shown a tendency to post sharp distribution days (closing at session lows with above-average volume), often followed by a rebound the next day or shortly thereafter (see the volume profile)
Chart:
ノート
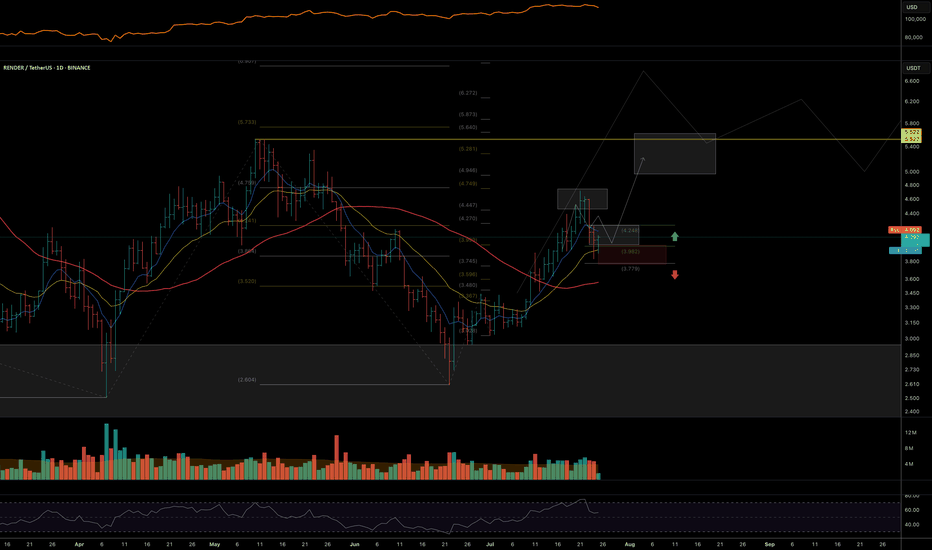
Price broke below both local and mid-term support, and is, as mentioned in my latest update, shifting the bullish structure into a diagonal (3-wave) pattern.I’m watching for a higher low to form in 400-390 support — aligning with
BTC’s higher low — followed by a base-building phase that could lead into the final leg up toward the macro $520 resistance zone. See todays market review that covers BTC trend structure.
Chart:
Todays crypto market review:
ノート
The original bullish case is now under pressure, with price breaking below mid-term support. While a running flat correction is still a valid scenario, the current structure looks fragile and may ultimately result in a lower high, even if BTC reaches new all-time highs.In the short term, I expect a local bottom formation, followed by a bounce into the 405–425/440 mid-term resistance zone.
- A break above 425–440 would reopen the path toward 500+.
- Failure to reclaim that level would reinforce the case for a deeper correction in the coming months.
Chart:
📊 Daily FREE Market Insights | Crypto + US Stocks
⚡ Technical analysis, setups & commentary
🌍 t.me/MarketArtistryENG | 🇷🇺 t.me/marketartistry
⚡ Technical analysis, setups & commentary
🌍 t.me/MarketArtistryENG | 🇷🇺 t.me/marketartistry
関連の投稿
免責事項
この情報および投稿は、TradingViewが提供または推奨する金融、投資、トレード、その他のアドバイスや推奨を意図するものではなく、それらを構成するものでもありません。詳細は利用規約をご覧ください。