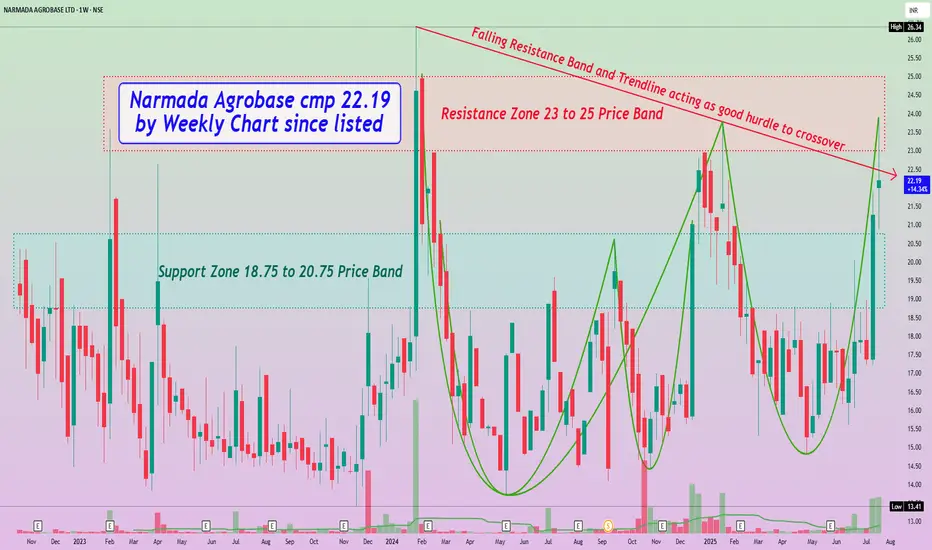
Narmada Agrobase cmp 22.19 by Weekly Chart since listed
- Support Zone 18.75 to 20.75 Price Band
- Resistance Zone seen at 23 to 25 Price Band
- Falling Resistance Band and Trendline acting as good hurdle to crossover
- Back to Back Bullish Rounding Bottoms formed at Resistance Zone neckline hurdle
- Volumes have spiked up heavily over past 2 weeks well above average traded quantity
- Most common Technical Indicators like BB, EMA, MACD, RSI, SAR are showing positive trend
免責事項
この情報および投稿は、TradingViewが提供または推奨する金融、投資、トレード、その他のアドバイスや推奨を意図するものではなく、それらを構成するものでもありません。詳細は利用規約をご覧ください。
免責事項
この情報および投稿は、TradingViewが提供または推奨する金融、投資、トレード、その他のアドバイスや推奨を意図するものではなく、それらを構成するものでもありません。詳細は利用規約をご覧ください。