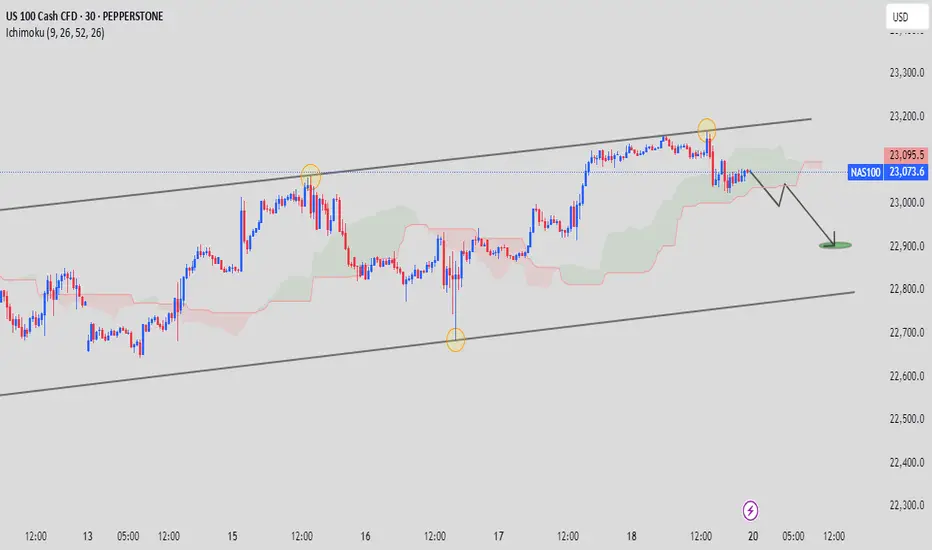
The NASDAQ100 continues to trade within a well-defined ascending parallel channel, respecting both the upper and lower boundaries, which have now been tested multiple times (marked by orange circles).
Currently, the price is reacting to a rejection at the channel top, near 23,200. This aligns with historical behavior at this resistance zone, suggesting a possible short-term pullback.
The Ichimoku Cloud is showing early signs of weakness:
Price has moved below the Tenkan-sen and is hovering near the Kijun-sen, signaling a possible trend shift.
The cloud ahead has flattened, often a precursor to consolidation or reversal.
Bearish price action is emerging just below the cloud, which often precedes deeper corrections when combined with resistance rejection.
---
📉 Bearish Scenario (Highlighted in Chart):
Expecting a short-term retracement toward the mid to lower range of the channel (target zone: 22,900–22,950).
This aligns with previous bounce points and a likely retest of the Ichimoku support structure.
A break below 22,900 would invalidate the channel and suggest a broader correction—watch closely.
---
🔑 Key Levels:
Resistance: 23,200 (Channel Top)
Support: 22,900 (Channel Midline / Prior Bounce)
Breakout Zone: Below 22,800 (Channel Invalidated)
---
🧠 Trade Idea:
Traders may consider a short setup near current levels (23,070–23,100) with a stop above 23,200, targeting 22,900 initially. As always, watch for volume confirmation and be mindful of news catalysts that may alter sentiment.
---
💬 Final Thoughts:
This analysis blends structure (channel) with momentum indicators (Ichimoku) to form a high-probability setup. Whether this becomes a deeper reversal or a temporary pullback, the chart offers a clean roadmap for risk-managed trades.
トレード稼働中
✅JOIN FREE TELEGRAM
✅t.me/+atTT3a4htZ8yZjQ0
✅DAILY 3-4 SIGNALS
✅ALL PAIRS CRYPTO & GOLD
✅t.me/+atTT3a4htZ8yZjQ0
✅DAILY 3-4 SIGNALS
✅ALL PAIRS CRYPTO & GOLD
関連の投稿
免責事項
これらの情報および投稿は、TradingViewが提供または保証する金融、投資、取引、またはその他の種類のアドバイスや推奨を意図したものではなく、またそのようなものでもありません。詳しくは利用規約をご覧ください。
✅JOIN FREE TELEGRAM
✅t.me/+atTT3a4htZ8yZjQ0
✅DAILY 3-4 SIGNALS
✅ALL PAIRS CRYPTO & GOLD
✅t.me/+atTT3a4htZ8yZjQ0
✅DAILY 3-4 SIGNALS
✅ALL PAIRS CRYPTO & GOLD
関連の投稿
免責事項
これらの情報および投稿は、TradingViewが提供または保証する金融、投資、取引、またはその他の種類のアドバイスや推奨を意図したものではなく、またそのようなものでもありません。詳しくは利用規約をご覧ください。