In the markets, the Fibonacci spiral isn't just a pattern—it's an engine of momentum. It reveals where price action compresses, aligns, and ultimately explodes.
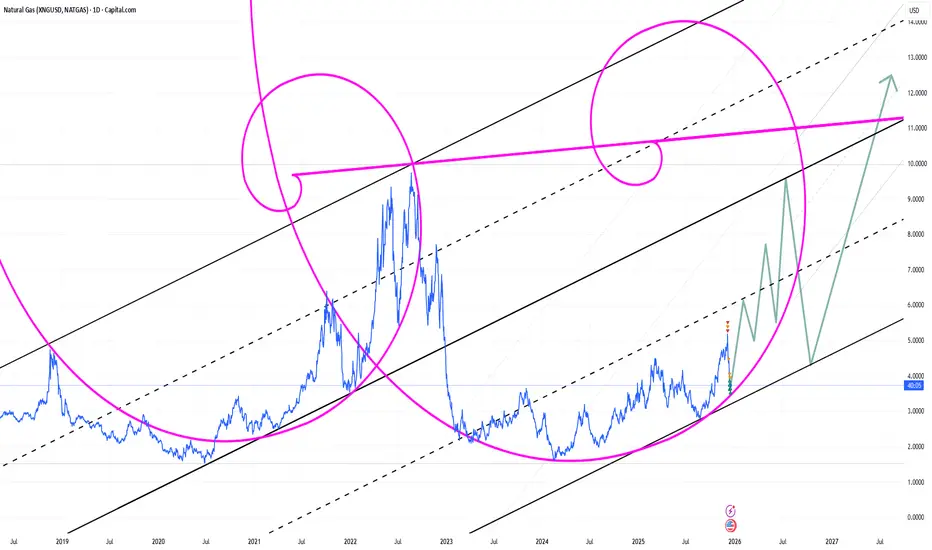
Think of a consolidation near a key Fibonacci level (like the 61.8% or 38.2% retracement) as the spiral winding tighter. This isn't random noise; it's energy being stored, a structural reformation where the market's natural growth geometry reasserts itself.
The moment price breaks decisively from this zone, it triggers the spiral's accelerating phase. This is why Fibonacci structures are powerful tools for identifying the launch point of sharp, impulsive moves—not for forecasting slow, grinding trends. They pinpoint where potential energy converts to kinetic momentum, offering a high-probability entry for capturing rapid expansion.
ノート
not a trading advice 関連の投稿
免責事項
この情報および投稿は、TradingViewが提供または推奨する金融、投資、トレード、その他のアドバイスや推奨を意図するものではなく、それらを構成するものでもありません。詳細は利用規約をご覧ください。
関連の投稿
免責事項
この情報および投稿は、TradingViewが提供または推奨する金融、投資、トレード、その他のアドバイスや推奨を意図するものではなく、それらを構成するものでもありません。詳細は利用規約をご覧ください。