📊 Overview
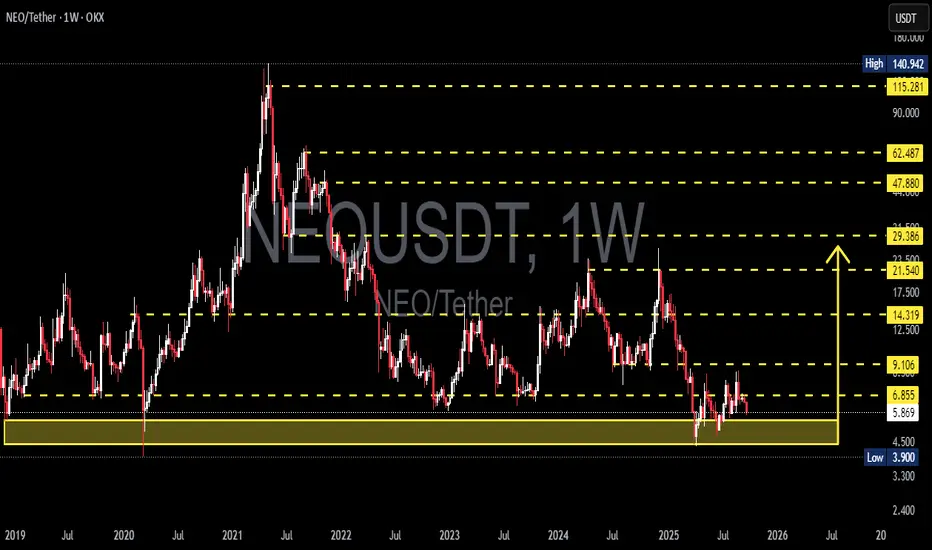
The NEO/USDT (Weekly, OKX) pair is currently sitting at a critical junction that could define its long-term direction. Since the 2021 peak, NEO has been in a macro downtrend, but once again it is testing the historical demand zone at 3.90 – 5.85 USDT (yellow box).
This zone isn’t just a minor support — it’s a multi-year structural level that has repeatedly acted as a floor since 2019.
---
🔍 Structure & Price Pattern
1. Macro Trend:
From the ATH ≈140 USDT (2021), price has consistently formed lower highs and lower lows.
Trend remains bearish, but extended consolidation at the lows suggests possible accumulation.
2. Key Levels:
Strong Support: 3.90 – 5.85 (multi-year demand).
Immediate Resistance: 6.855 USDT.
Next Resistance Levels: 9.106 → 14.319 → 21.540 → 29.386.
Psychological Long-Term Levels: 47.880, 62.487, 115.281, and ATH at 140.942.
3. Potential Patterns:
Holding above the yellow box + breakout over 6.855 could trigger a base breakout / double bottom reversal.
A breakdown below 3.90, however, would confirm a bearish continuation with significant downside risk.
---
🟢 Bullish Scenario
1. Early Confirmation:
Weekly close above 6.855 USDT.
2. Upside Targets:
Target 1: 9.106 USDT.
Target 2: 14.319 USDT.
Target 3: 21.540 USDT (macro structure begins shifting bullish if broken).
3. Supporting Signals:
Strong breakout volume.
RSI reclaiming > 50.
Bullish weekly candlestick closes near the highs.
---
🔴 Bearish Scenario
1. Early Confirmation:
Weekly close below 3.90 USDT.
2. Implications:
Loss of multi-year demand zone.
Opens the door for deeper downside with no clear structural support below.
3. Supporting Signals:
Lower highs failing near 6.855.
RSI staying below 50.
Weak volume on rallies, strong volume on sell-offs.
---
🎯 Conclusion & Sentiment
The 3.90 – 5.85 USDT zone = “Last Defense Zone” for NEO.
Holding this level could spark a long-term reversal toward 9 – 14 USDT.
Breaking below would signal a continuation of the multi-year downtrend with significant downside risk.
At this moment, NEO stands at a crossroad:
➡️ Will it be the start of a new bullish cycle after years of consolidation?
⬅️ Or will it break down its last major support and extend the bearish cycle further?
---
🔑 Notes for Traders
Always wait for weekly close confirmation to avoid bull/bear traps.
Watch the reaction at 3.90 – 5.85 USDT, as it’s critical for both swing traders and long-term investors.
Apply strict risk management (SL/TP), as volatility in this zone can be very high.
---
#NEO #NEOUSDT #NEOAnalysis #Altcoins #CryptoTrading #SwingTrade #SupportResistance #TechnicalAnalysis #CryptoMarket
✅ Get Free Signals! Join Our Telegram Channel Here: t.me/TheCryptoNuclear
✅ Twitter: twitter.com/crypto_nuclear
✅ Join Bybit : partner.bybit.com/b/nuclearvip
✅ Benefits : Lifetime Trading Fee Discount -50%
✅ Twitter: twitter.com/crypto_nuclear
✅ Join Bybit : partner.bybit.com/b/nuclearvip
✅ Benefits : Lifetime Trading Fee Discount -50%
免責事項
これらの情報および投稿は、TradingViewが提供または保証する金融、投資、取引、またはその他の種類のアドバイスや推奨を意図したものではなく、またそのようなものでもありません。詳しくは利用規約をご覧ください。