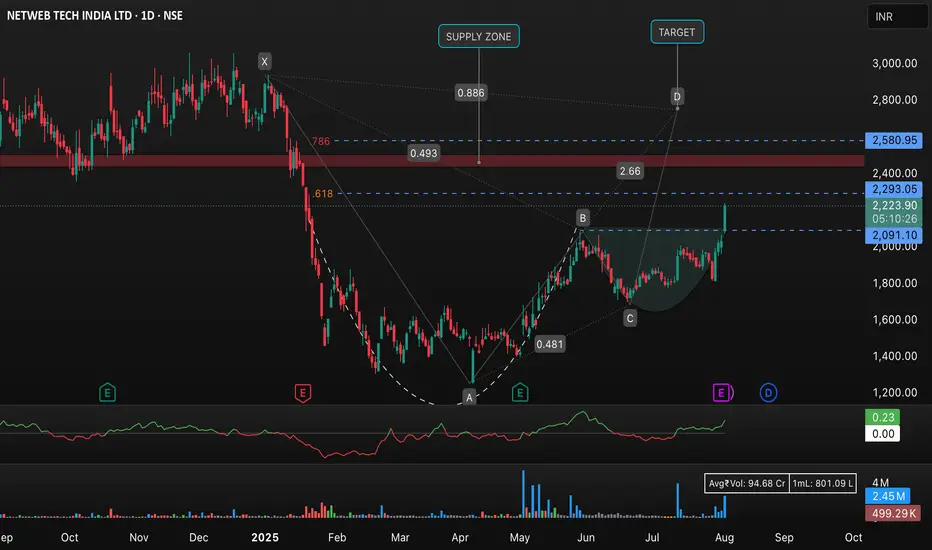
This chart of NETWEB TECH INDIA LTD (NSE: NETWEB) highlights a notable Cup and Handle pattern formation observed on the daily timeframe. The stock has just broken out above resistance with strong momentum (+9.96%).
• Key Levels:
• Support at 2,091.10 INR
• Immediate resistance/supply zone at 2,293.05–2,580.95 INR
• Target projected around 2,580.95 INR
• Technical Insights:
• Cup and Handle breakout with above-average volume
• Fibonacci retracement and extension levels marked for confirmation
• Potential for bullish continuation if breakout sustains
• Monitor for price action near the supply zone and watch for profit-booking signals
This setup provides a positive risk-reward for swing traders, but always ensure to manage risks and confirm with additional indicators.
トレード稼働中
• The stock is trading strongly at 2,298.50, showing bullish momentum with a sharp rise and high volume.• Key resistance levels are at 2,293, 2,580.95, and the marked supply zone between these levels. This is where profit booking or selling pressure might increase.
• Immediate support for any pullback is at 2,091.10.
• The pattern resembles a bullish cup-and-handle breakout, and if current levels hold, the swing target sits around 2,580.95.
• Trend and momentum indicators point to continued strength, but caution is advised near resistance zones and with proper stop-loss placement below 2,091.10.
トレード終了: 利益確定目標に到達
About to hit tgt免責事項
The information and publications are not meant to be, and do not constitute, financial, investment, trading, or other types of advice or recommendations supplied or endorsed by TradingView. Read more in the Terms of Use.
免責事項
The information and publications are not meant to be, and do not constitute, financial, investment, trading, or other types of advice or recommendations supplied or endorsed by TradingView. Read more in the Terms of Use.