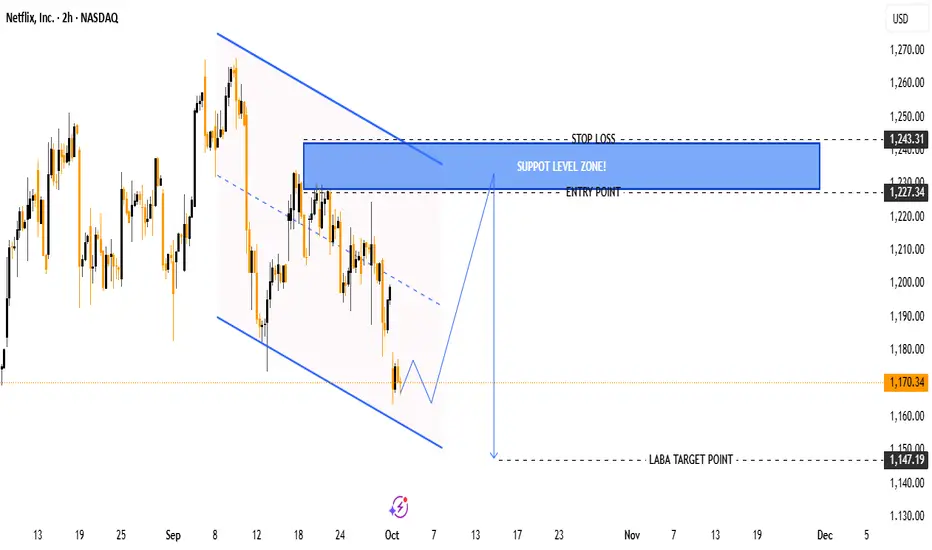
Ticker: Netflix (NFLX)
Timeframe: 2H (2-hour chart)
Current Price: $1,170.34
Chart Pattern: Descending channel (bearish trend continuation setup).
📉 Key Levels
Entry Point: $1,227.34
Marked as the level where price might retrace before resuming downward.
Stop Loss: $1,243.31
Positioned above the support/resistance flip zone to protect from false breakouts.
Target Point (LABA): $1,147.19
Expected downside target if the bearish move continues.
🧩 Technical Structure
The chart shows price moving within a descending channel.
The current price ($1,170.34) is near the lower boundary of the channel.
The analysis suggests a possible retracement (pullback) upward toward the support zone (blue area) before continuing the downtrend.
The blue box zone ($1,227 – $1,243) is a critical liquidity zone / resistance area, expected to reject price lower.
📊 Trading Plan (as per chart)
Sell/Short Setup:
Wait for retracement into the blue resistance zone ($1,227 – $1,243).
Enter short around $1,227.
Place Stop Loss above $1,243.
Take Profit near $1,147.
Risk/Reward:
Risk = ~ $16 (1,243 – 1,227).
Reward = ~ $80 (1,227 – 1,147).
Approx. R:R ratio = 1:5 (highly favorable).
✅ Summary:
This chart suggests Netflix (NFLX) is in a downtrend within a descending channel. A pullback to the $1,227–$1,243 zone could offer a shorting opportunity targeting $1,147, with a strong risk/reward ratio.
join my telegram channel t.me/goldmitalteam
t.me/goldmitalteam
t.me/goldmitalteam
免責事項
この情報および投稿は、TradingViewが提供または推奨する金融、投資、トレード、その他のアドバイスや推奨を意図するものではなく、それらを構成するものでもありません。詳細は利用規約をご覧ください。
join my telegram channel t.me/goldmitalteam
t.me/goldmitalteam
t.me/goldmitalteam
免責事項
この情報および投稿は、TradingViewが提供または推奨する金融、投資、トレード、その他のアドバイスや推奨を意図するものではなく、それらを構成するものでもありません。詳細は利用規約をご覧ください。