Netflix enters the shortlist this week.
A potential buy zone is approaching, with momentum indicators turning interesting.
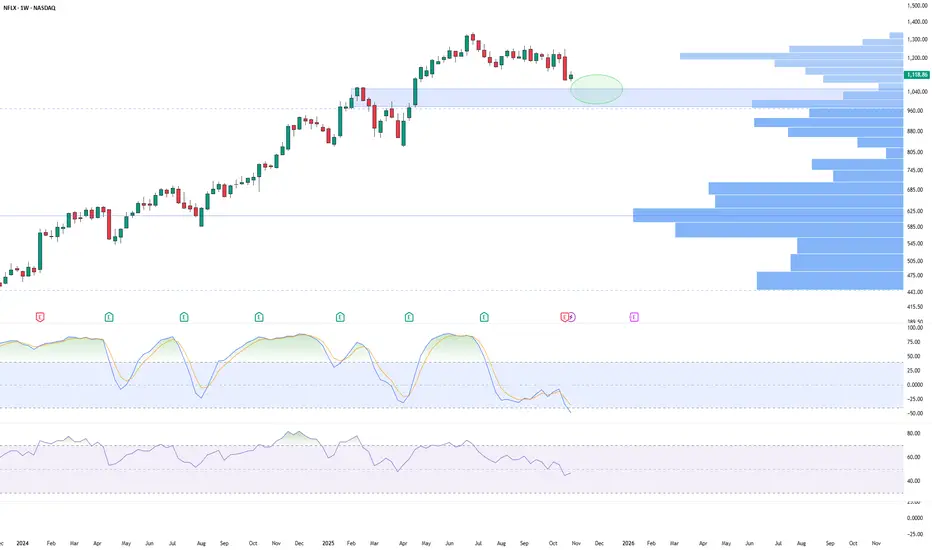
My custom indicator The Wave is flashing a potential long setup, right around the $1,000 area, maybe slightly above.
Earnings are already behind us, which clears the way for clean price action.
The long-term uptrend that started in late 2023 remains intact.
Bullish structure still in place and a possible setup forming for patient swing traders.
Let’s see how this zone reacts in the coming weeks.
A potential buy zone is approaching, with momentum indicators turning interesting.
My custom indicator The Wave is flashing a potential long setup, right around the $1,000 area, maybe slightly above.
Earnings are already behind us, which clears the way for clean price action.
The long-term uptrend that started in late 2023 remains intact.
Bullish structure still in place and a possible setup forming for patient swing traders.
Let’s see how this zone reacts in the coming weeks.
Mike
免責事項
この情報および投稿は、TradingViewが提供または推奨する金融、投資、トレード、その他のアドバイスや推奨を意図するものではなく、それらを構成するものでもありません。詳細は利用規約をご覧ください。
Mike
免責事項
この情報および投稿は、TradingViewが提供または推奨する金融、投資、トレード、その他のアドバイスや推奨を意図するものではなく、それらを構成するものでもありません。詳細は利用規約をご覧ください。