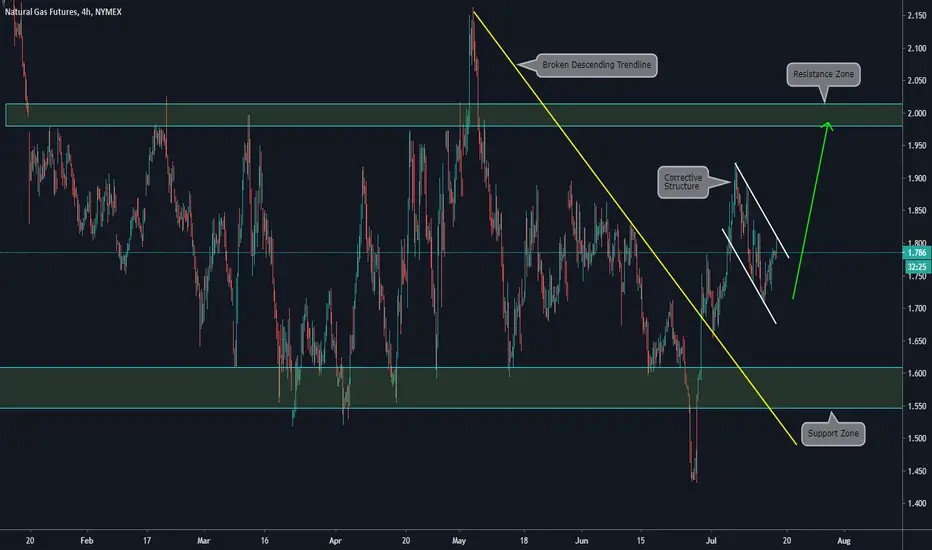
Main items we can see on the chart:
a) The price is inside a clear range, between a support and a resistance zone
b) Inside the range, we can see a broken descending trendline after the price bounced on the support zone
c) After the breakout, we can see a corrective Structure
d) If the Corrective Structure is broken we expect a continuation of the bullish movement, towards the next resistance zone
免責事項
この情報および投稿は、TradingViewが提供または推奨する金融、投資、トレード、その他のアドバイスや推奨を意図するものではなく、それらを構成するものでもありません。詳細は利用規約をご覧ください。
免責事項
この情報および投稿は、TradingViewが提供または推奨する金融、投資、トレード、その他のアドバイスや推奨を意図するものではなく、それらを構成するものでもありません。詳細は利用規約をご覧ください。