Use this as a guide to develop your view:
Main items we can observe on the 4HS chart:
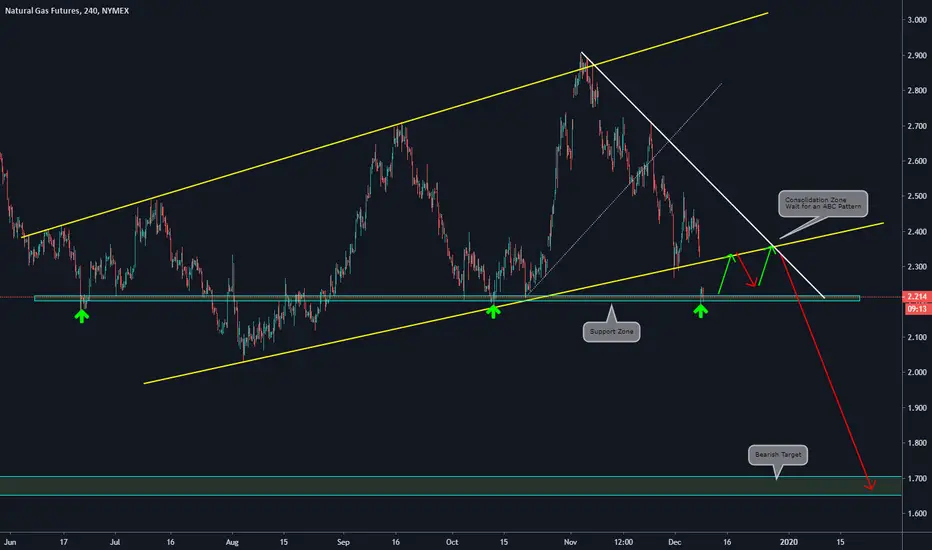
a)Price has broken the primary structure (yellow lines) with a bearish movement
b)The price found support on the 2.20 level
c)We Expect an ABC formation with a pullback to the broken structure
d)If the ABC formation happens, we forecast a continuation of the bearish movement towards the next support zone at the 1.7 level
Daily Vision:

Weekly Vision:

Main items we can observe on the 4HS chart:
a)Price has broken the primary structure (yellow lines) with a bearish movement
b)The price found support on the 2.20 level
c)We Expect an ABC formation with a pullback to the broken structure
d)If the ABC formation happens, we forecast a continuation of the bearish movement towards the next support zone at the 1.7 level
Daily Vision:
Weekly Vision:
免責事項
この情報および投稿は、TradingViewが提供または推奨する金融、投資、トレード、その他のアドバイスや推奨を意図するものではなく、それらを構成するものでもありません。詳細は利用規約をご覧ください。
免責事項
この情報および投稿は、TradingViewが提供または推奨する金融、投資、トレード、その他のアドバイスや推奨を意図するものではなく、それらを構成するものでもありません。詳細は利用規約をご覧ください。