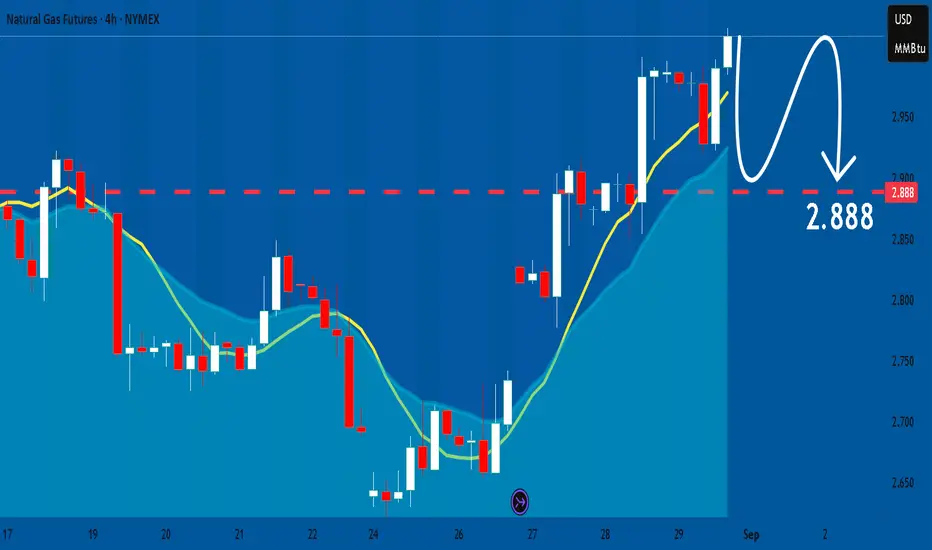
It is essential that we apply multitimeframe technical analysis and there is no better example of why that is the case than the current NATGAS chart which, if analyzed properly, clearly points in the downward direction.
Disclosure: I am part of Trade Nation's Influencer program and receive a monthly fee for using their TradingView charts in my analysis.
❤️Please, support our work with like & comment!❤️
✅ Subscribe to our Free Signal Telegram Channel 👉👉👉 t.me/UnitedSignalsFX ✅
💰For Best Trading Signals ➡️➡️➡️ t.me/UnitedSignalsFX 💰
🔥Best FOREX GOLD BROKER ➡️ go.tradenation.com/visit/?bta=37173&brand=tradenation
💰For Best Trading Signals ➡️➡️➡️ t.me/UnitedSignalsFX 💰
🔥Best FOREX GOLD BROKER ➡️ go.tradenation.com/visit/?bta=37173&brand=tradenation
関連の投稿
免責事項
これらの情報および投稿は、TradingViewが提供または保証する金融、投資、取引、またはその他の種類のアドバイスや推奨を意図したものではなく、またそのようなものでもありません。詳しくは利用規約をご覧ください。