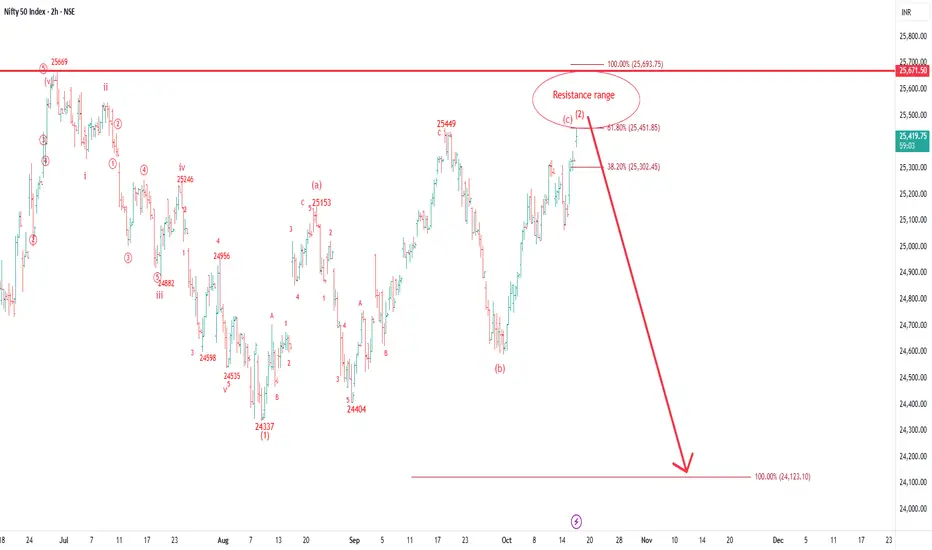
In this 2hour chart Nifty formed a corrective pattern from 24337 and now it is near to its completion range and soon may decline below 24300 in coming days/weeks.
This analysis is based on Elliott wave Theory so If you have not understand Elliott wave then kindly ignore it.
Thank you.
This analysis is based on Elliott wave Theory so If you have not understand Elliott wave then kindly ignore it.
Thank you.
免責事項
これらの情報および投稿は、TradingViewが提供または保証する金融、投資、取引、またはその他の種類のアドバイスや推奨を意図したものではなく、またそのようなものでもありません。詳しくは利用規約をご覧ください。
免責事項
これらの情報および投稿は、TradingViewが提供または保証する金融、投資、取引、またはその他の種類のアドバイスや推奨を意図したものではなく、またそのようなものでもありません。詳しくは利用規約をご覧ください。