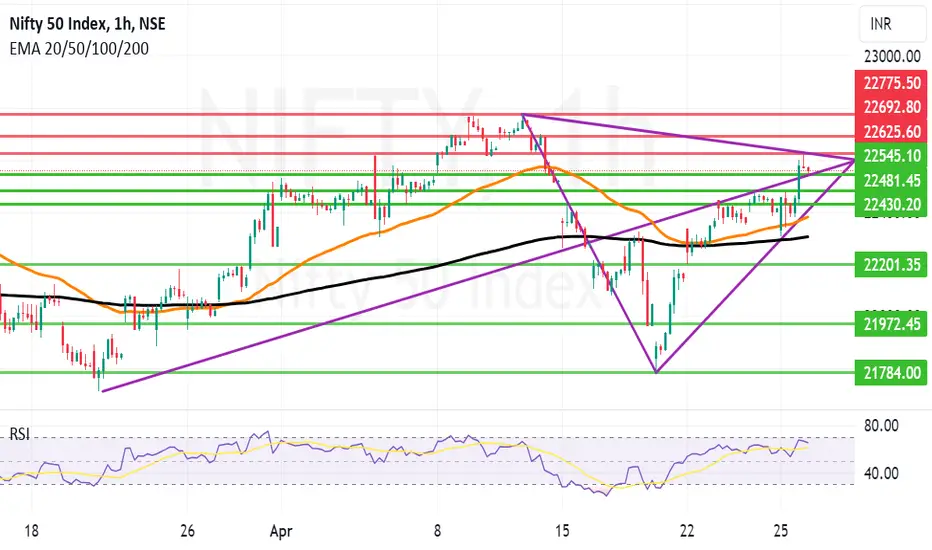
Arrow in the chart of Nifty is pointing in the direction of which Nifty intends to go in the long term. There may be some slip-ups in the short run but in the long run Nifty will be seen travelling in the direction the arrow is pointing.
Today Nifty returned from an important trendline resistance of 22625. crossing the same will be a little bit of a challenge. If we get a weekly closing above 22625 Nifty can quickly make new highs in the coming days with resistance at 22692 and 22775.
In case the mid arrow support is broken tomorrow we may see a down side with supports at 22545, 22481, 22430, 22380 and 22304. Below 22304 Nifty becomes weak again and bears can start calling the shots.
Shadow of the candle is negative to neutral as of now.
免責事項
これらの情報および投稿は、TradingViewが提供または保証する金融、投資、取引、またはその他の種類のアドバイスや推奨を意図したものではなく、またそのようなものでもありません。詳しくは利用規約をご覧ください。
免責事項
これらの情報および投稿は、TradingViewが提供または保証する金融、投資、取引、またはその他の種類のアドバイスや推奨を意図したものではなく、またそのようなものでもありません。詳しくは利用規約をご覧ください。