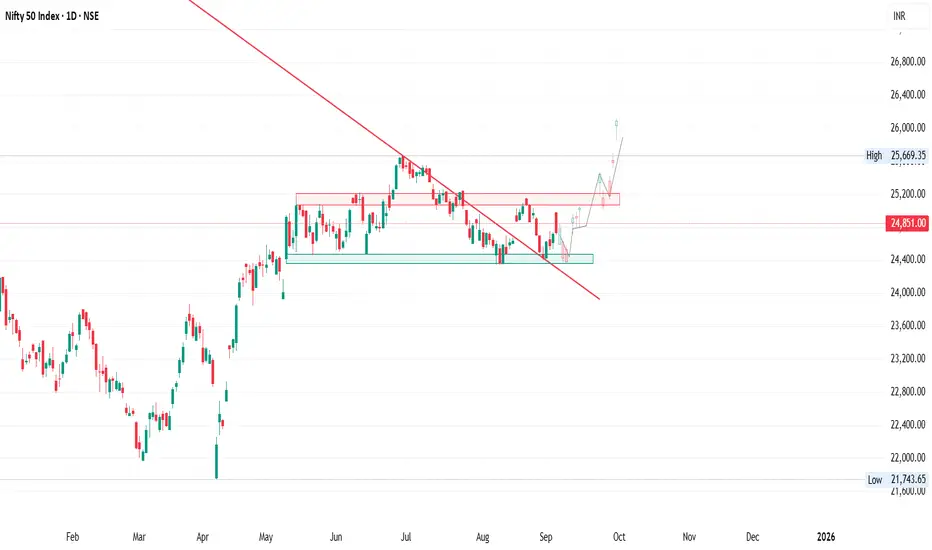
Nifty has already broken out of a downward sloping trendline (marked in red).
Breakout was supported by price bouncing twice from the demand zone
Support Zone:
Strong base identified around 24500(Green box).
This zone has repeatedly acted as demand, preventing deeper correction.
Resistance Zones:
Overhead resistance at 25000–250100 (Red box).
Sustained move above this zone can confirm bullish continuation.
Price Structure:
After breakout, price is retesting its old support.
If this retest holds, Nifty may resume its upward path toward higher targets.
Disclaimer: This is an educational analysis based on price action on the daily chart. Not financial advice. Always use risk management and confirm with your own trading plan.
免責事項
これらの情報および投稿は、TradingViewが提供または保証する金融、投資、取引、またはその他の種類のアドバイスや推奨を意図したものではなく、またそのようなものでもありません。詳しくは利用規約をご覧ください。
免責事項
これらの情報および投稿は、TradingViewが提供または保証する金融、投資、取引、またはその他の種類のアドバイスや推奨を意図したものではなく、またそのようなものでもありません。詳しくは利用規約をご覧ください。