検索
プロダクト
コミュニティ
マーケット
ブローカー
詳細
JA
始めましょう
Nifty50指数
ロング
更新済
7月27日
Nifty ki Moh-Maya @ 15 minute via curve line
1
このチャートを取得
このチャートを取得
1
1
147
6月26日
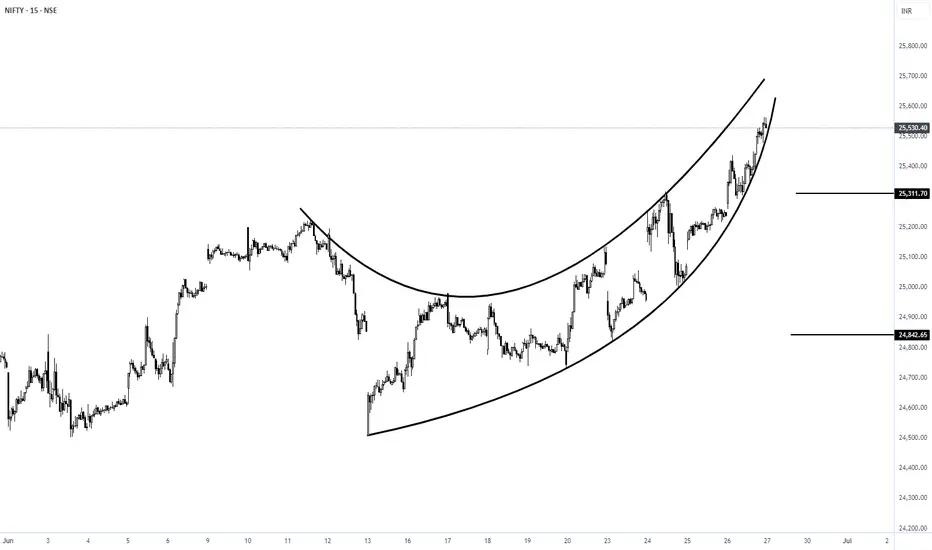
nifty 15 minute curve line analysis
if breaks below lower line could be negative
nearest 1st support is 25300
2nd support is 25000
3rd support is 24840
6月26日
ノート
7月16日
ノート
1st target fully achieved
7月25日
ノート
achieved all target click on play button on main chart post
7月25日
ノート
acheived 100% accurately
7月25日
ノート
7月27日
トレード終了: 利益確定目標に到達
sk_4587
フォロー
Chart Patterns
Technical Indicators
Trend Analysis
関連の投稿
bajaj finance monthly breakout after 4 years of non performance
sk_4587の投稿
Nifty trend analysis on Daily candle
sk_4587の投稿
Reliance Daily support between 1270 to 1300
sk_4587の投稿
hdfclife 3-hour long setup
sk_4587の投稿
solarindus price reading on daily candle
sk_4587の投稿
免責事項
これらの情報および投稿は、TradingViewが提供または保証する金融、投資、取引、またはその他の種類のアドバイスや推奨を意図したものではなく、またそのようなものでもありません。詳しくは
利用規約
をご覧ください。
Chart Patterns
Technical Indicators
Trend Analysis
sk_4587
フォロー
関連の投稿
bajaj finance monthly breakout after 4 years of non performance
sk_4587の投稿
Nifty trend analysis on Daily candle
sk_4587の投稿
Reliance Daily support between 1270 to 1300
sk_4587の投稿
hdfclife 3-hour long setup
sk_4587の投稿
solarindus price reading on daily candle
sk_4587の投稿
免責事項
これらの情報および投稿は、TradingViewが提供または保証する金融、投資、取引、またはその他の種類のアドバイスや推奨を意図したものではなく、またそのようなものでもありません。詳しくは
利用規約
をご覧ください。