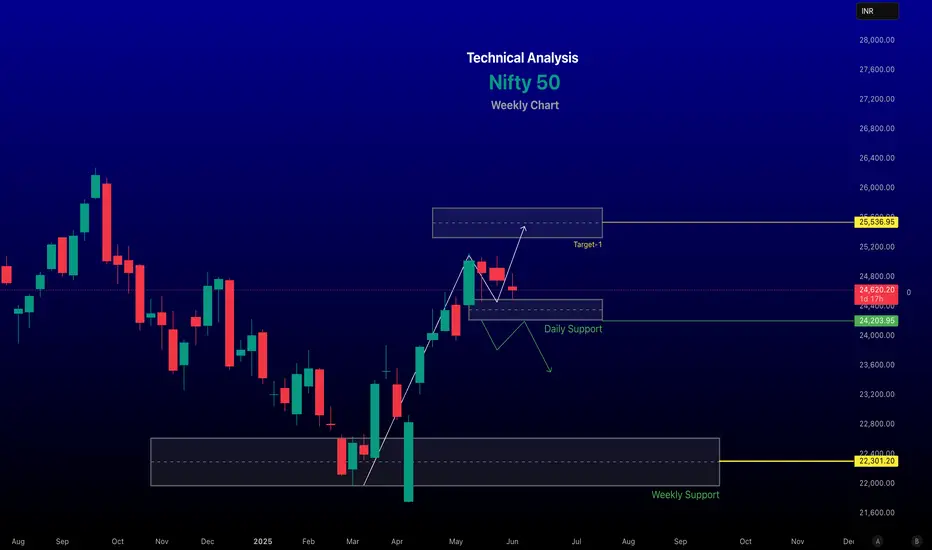
~~ Technical Analysis ~~
Trend: The Nifty 50 is currently in a Sideways trend. A close above 25800 level could signal a shift to a bullish trend.
#Support and Resistance:
Support: Key levels at 24,552, 24,485, and 24,200 further buying expected near 24,300 if breached.
Resistance: Immediate resistance at 24,666, 24,712, and 24,780. A breakout above 24,900 could push the index toward 25,200–25,600, while a sustained move above 25,050–25,070 may target 25,350–25,600.
Chart Patterns: The Nifty is consolidating within a 24,600–25,050 range, moving within an ascending channel. A bearish candle formed recently, breaching the 20-day EMA, indicating potential weakness unless it holds above 24,300.
Momentum Indicators: The Relative Strength Index (RSI) is mildly bullish at 65.47 for Bank Nifty, but Nifty-specific RSI data suggests consolidation. Oversold conditions (RSI sub-30) have historically signaled potential bottoms or bounces at levels like 23,900–24,100.
-- Disclaimer --
This analysis is based on recent technical data and market sentiment from web sources. It is for informational and educational purposes only and not financial advice. Trading involves high risks, and past performance does not guarantee future results. Always conduct your own research or consult a SEBI-registered advisor before trading.
#Boost and comment will be highly appreciated
トレード稼働中
upper target is about to hitrenderwithme
関連の投稿
免責事項
これらの情報および投稿は、TradingViewが提供または保証する金融、投資、取引、またはその他の種類のアドバイスや推奨を意図したものではなく、またそのようなものでもありません。詳しくは利用規約をご覧ください。
renderwithme
関連の投稿
免責事項
これらの情報および投稿は、TradingViewが提供または保証する金融、投資、取引、またはその他の種類のアドバイスや推奨を意図したものではなく、またそのようなものでもありません。詳しくは利用規約をご覧ください。