📊 NIFTY 50 Weekly Analysis – Elliott Wave & Retracement Outlook (April Week 2)
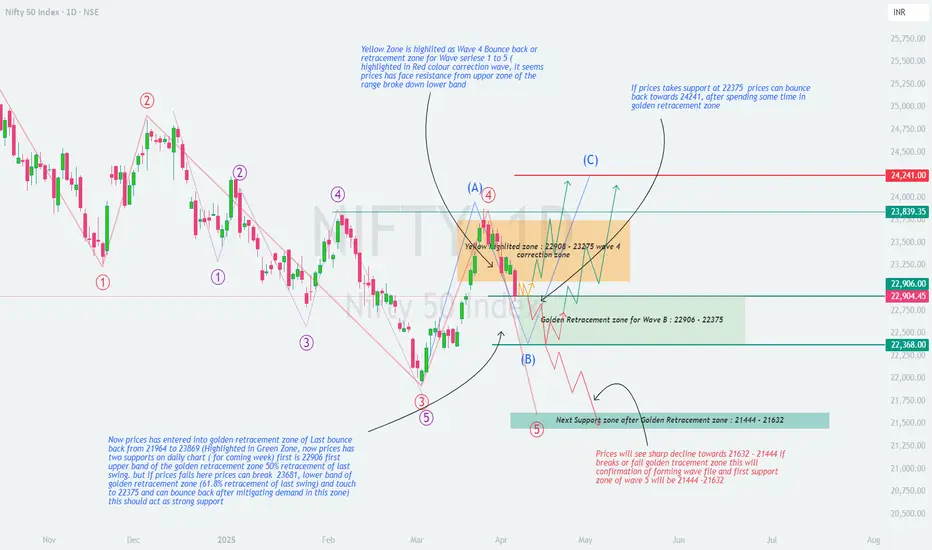
As per the latest Elliott Wave analysis and Fibonacci retracement zones plotted on the chart, NIFTY is currently at a critical juncture. Price action from here will define whether the market resumes upward correction or heads for a deeper fall.
🧠 Technical Structure Overview
The red-labelled impulse wave series 1 to 5 has completed, indicating a completed correction wave structure.
A corrective bounce has been observed post-Wave 5 in the form of Wave A.
Price is now moving in a Wave B correction and has entered a key Fibonacci retracement zone.
📍 Important Zones to Watch
🔶 Yellow Zone – Wave 4 Correction Resistance:
Range: 22,908 – 23,275
This was a previous bounce zone (Wave 4), now acting as a resistance range.
Price faced strong rejection here and reversed down into retracement territory.
🟩 Golden Fibonacci Retracement Zone for Wave B:
Range: 22,906 – 22,368
Price has entered this critical retracement zone.
This range corresponds to:
50% retracement = 22,906 (upper band)
61.8% retracement = 22,368 (lower band)
Implication: If NIFTY sustains within this zone and forms a base, it may initiate a move towards Wave C.
🧭 Scenarios for Coming Week
✅ Bullish Scenario:
If price sustains above 22,368 and reclaims 22,906, it can bounce back towards:
🎯 Target 1: 23,839
🎯 Target 2: 24,241 (Wave C projection)
Confluence: Wave A-B-C projection fits well within this move.
❌ Bearish Scenario:
If price breaks below 22,368 and fails to hold the golden zone:
Expect a sharp decline towards support zone: 21,444 – 21,632
This move would confirm the formation of another impulsive Wave 5 down.
🔍 Key Support and Resistance Levels
Resistance:
22,908
23,275
23,839
24,241
Support:
22,906 (Upper Golden Zone)
22,368 (Lower Golden Zone)
21,632 – 21,444 (Major Support Zone)
📌 Conclusion:
NIFTY is in a decisive zone. Whether we go for Wave C up or another Wave 5 down depends on price action within the 22,906 – 22,368 zone.
Traders should:
Watch for confirmation candles and volumes.
Use demand zone reactions to position accordingly.
Maintain strict risk management.
💬 Share your views in the comments – do you expect a bounce from here or a breakdown?
#NIFTY50 #ElliottWave #TechnicalAnalysis #TradingView #NIFTYAnalysis #Fibonacci #SwingTrading #PriceAction
トレード終了: 利益確定目標に到達
免責事項
この情報および投稿は、TradingViewが提供または推奨する金融、投資、トレード、その他のアドバイスや推奨を意図するものではなく、それらを構成するものでもありません。詳細は利用規約をご覧ください。
免責事項
この情報および投稿は、TradingViewが提供または推奨する金融、投資、トレード、その他のアドバイスや推奨を意図するものではなく、それらを構成するものでもありません。詳細は利用規約をご覧ください。