📈 Keep It Simple, Keep It Powerful
When price action starts making sense, you’ll realize how far a single Support and Resistance line can take you.
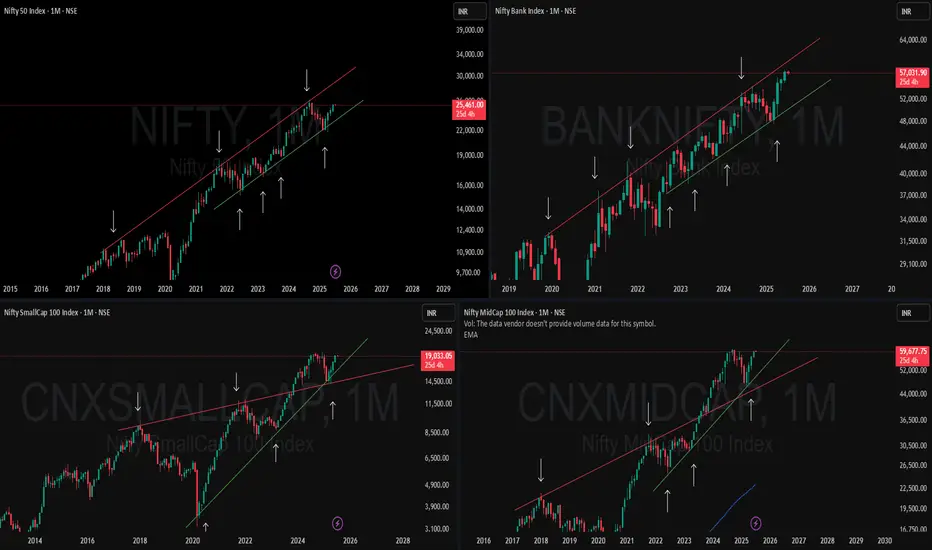
🟥🟩 NIFTY & BANKNIFTY – Two clear examples of parallel channel trends, marching higher with clean Higher Highs and Higher Lows.
🟩🟥 MIDCAP & SMALLCAP – Not just catching up, but breaking out of Multi-Timeframe contraction patterns with strength — a sign of broader market participation.
They're now retesting and reclaiming previous highs after a much-needed breather.
💡What this chart tells us:
-Trendlines aren't just lines—they’re psychological guides to institutional and retail behavior.
-All four indices are moving in structured, rhythmic patterns.
-Simplicity works best. The markets speak clearly when you know what to listen for.
When price action starts making sense, you’ll realize how far a single Support and Resistance line can take you.
🟥🟩 NIFTY & BANKNIFTY – Two clear examples of parallel channel trends, marching higher with clean Higher Highs and Higher Lows.
🟩🟥 MIDCAP & SMALLCAP – Not just catching up, but breaking out of Multi-Timeframe contraction patterns with strength — a sign of broader market participation.
They're now retesting and reclaiming previous highs after a much-needed breather.
💡What this chart tells us:
-Trendlines aren't just lines—they’re psychological guides to institutional and retail behavior.
-All four indices are moving in structured, rhythmic patterns.
-Simplicity works best. The markets speak clearly when you know what to listen for.
🎯 Master My Self-Made Trading Strategy
📈 Telegram (Learn Today): t.me/hashtaghammer
✅ WhatsApp (Learn Today): wa.me/919455664601
📈 Telegram (Learn Today): t.me/hashtaghammer
✅ WhatsApp (Learn Today): wa.me/919455664601
関連の投稿
免責事項
これらの情報および投稿は、TradingViewが提供または保証する金融、投資、取引、またはその他の種類のアドバイスや推奨を意図したものではなく、またそのようなものでもありません。詳しくは利用規約をご覧ください。