🏦 NIFTY 50 INDEX – Double Top Pattern Formation with Gap Below | 15-Min Chart
📅 Date: April 28, 2025
📈 Timeframe: 15-Minute
🔍 Index: Nifty 50 (NSE)
📌 Technical Overview:
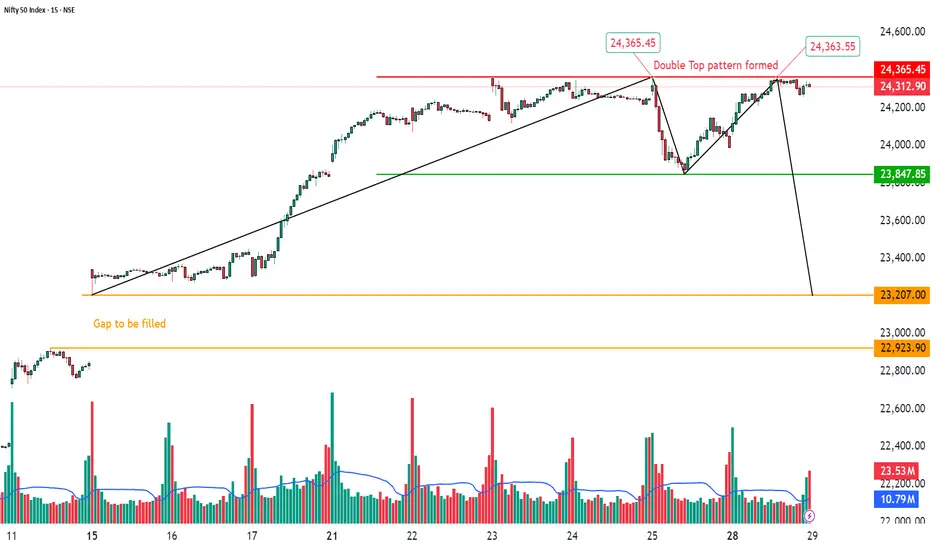
Nifty 50 has formed a Double Top pattern on the 15-minute chart around the 24,365 zone, a classic bearish reversal structure.
The price faced rejection at the previous high, signaling caution. Immediate support lies at 23,847, and a breakdown below this level could open downside momentum toward the gap area visible on the chart.
🧩 Chart Pattern:
Double Top identified at 24,365 levels (marked in red).
Neckline support positioned at 23,847 (green line).
A black trendline breakdown already visible, strengthening bearish bias.
Below 23,847, focus shifts to the gap fill zone between 23,207 and 22,923 (orange highlighted).
🔍 Key Price Levels:
Resistance: 24,365
Immediate Support: 23,847
Gap Zone Support: 23,207–22,923
CMP: 24,312.90
A clear breakdown below 23,847 could accelerate the fall toward the gap area.
📊 Volume Analysis:
Increasing selling volume observed near the second top.
The breakout attempt was met with significant volume resistance, hinting at supply dominance.
🧠 Observational Bias:
As long as Nifty stays below 24,365 and breaches 23,847 decisively, bears may remain in control. Traders should watch for either a gap fill attempt or a possible bounce if price retests 23,847 from below.
📅 Date: April 28, 2025
📈 Timeframe: 15-Minute
🔍 Index: Nifty 50 (NSE)
📌 Technical Overview:
Nifty 50 has formed a Double Top pattern on the 15-minute chart around the 24,365 zone, a classic bearish reversal structure.
The price faced rejection at the previous high, signaling caution. Immediate support lies at 23,847, and a breakdown below this level could open downside momentum toward the gap area visible on the chart.
🧩 Chart Pattern:
Double Top identified at 24,365 levels (marked in red).
Neckline support positioned at 23,847 (green line).
A black trendline breakdown already visible, strengthening bearish bias.
Below 23,847, focus shifts to the gap fill zone between 23,207 and 22,923 (orange highlighted).
🔍 Key Price Levels:
Resistance: 24,365
Immediate Support: 23,847
Gap Zone Support: 23,207–22,923
CMP: 24,312.90
A clear breakdown below 23,847 could accelerate the fall toward the gap area.
📊 Volume Analysis:
Increasing selling volume observed near the second top.
The breakout attempt was met with significant volume resistance, hinting at supply dominance.
🧠 Observational Bias:
As long as Nifty stays below 24,365 and breaches 23,847 decisively, bears may remain in control. Traders should watch for either a gap fill attempt or a possible bounce if price retests 23,847 from below.
手動でトレードを終了しました
STWP | Mentor & Demand-Supply Specialist | Empowering traders through structured learning |
simpletradewithpatience.com
Community: chat.whatsapp.com/BEYz0tkqP0fJPBCWf59uel
wa.me/message/6IOPHGOXMGZ4N1
Educational Only
simpletradewithpatience.com
Community: chat.whatsapp.com/BEYz0tkqP0fJPBCWf59uel
wa.me/message/6IOPHGOXMGZ4N1
Educational Only
免責事項
この情報および投稿は、TradingViewが提供または推奨する金融、投資、トレード、その他のアドバイスや推奨を意図するものではなく、それらを構成するものでもありません。詳細は利用規約をご覧ください。