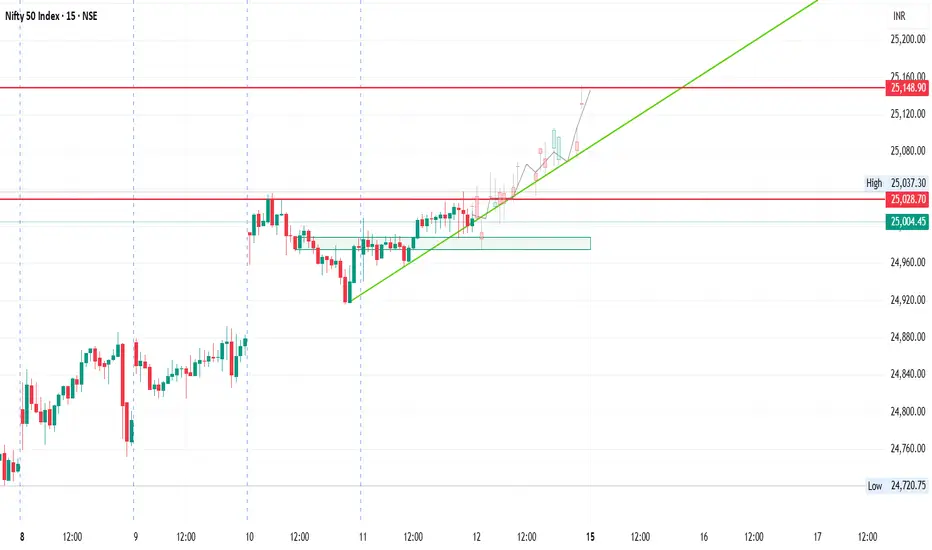
Ascending Trendline (Green): Nifty is respecting the rising trendline, confirming higher lows on the 15-minute chart. As long as this holds, the short-term bias remains bullish.
Support Zone (Green Box): Strong intraday demand has formed near 24980–25000, acting as the immediate floor.
Resistance Zone (Red Line): Overhead hurdle sits at 25030, followed by the next target at 25150.
Bearish Case (Trendline Break Risk)
If Nifty fails to hold the rising trendline and slips below 24980, selling pressure may increase.
Downside targets: 24920 → 24880.
免責事項
これらの情報および投稿は、TradingViewが提供または保証する金融、投資、取引、またはその他の種類のアドバイスや推奨を意図したものではなく、またそのようなものでもありません。詳しくは利用規約をご覧ください。
免責事項
これらの情報および投稿は、TradingViewが提供または保証する金融、投資、取引、またはその他の種類のアドバイスや推奨を意図したものではなく、またそのようなものでもありません。詳しくは利用規約をご覧ください。