Hello Mates, Hope everyone’s doing great and enjoying the charts so today let’s explore one of the most important market concepts that how an All-Time High gradually evolves into a fresh Support and Resistance cycle.
Understanding the Market’s Natural Rhythm--::
Every chart tells a story a story of enthusiasm, correction, recovery, and retest.
Price action moves in cycles, and one of the most powerful yet simple cycles is when a market makes an All-Time High, corrects into a Support Zone, and then forms a New Resistance before deciding its next direction.
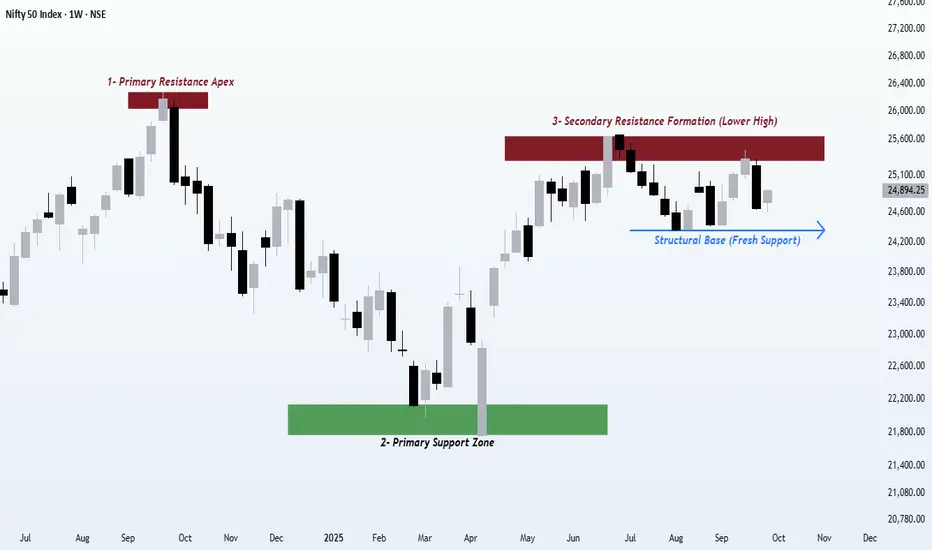
This NIFTY 50 weekly chart beautifully captures that structure a sequence every trader should recognize to understand market behavior with more clarity.
1️⃣ Major Swing High (The All-Time High)
At this stage, optimism dominates and new buyers rush in, assuming the trend will never end.
However, this is also where smart money begins distributing positions quietly.
You’ll often notice slowing momentum, smaller candle bodies, or divergence on oscillators.
This “All-Time High” is not just a price it’s the point where supply pressure starts building and emotional euphoria reaches its peak.
2️⃣ Primary Demand Zone (Support After the All-Time High)
As the correction begins, emotional traders exit while strong hands start building positions again.
The price eventually finds primary demand a zone that often aligns with previous breakout areas or major volume clusters.
This becomes a high-value area, where institutional accumulation quietly begins.
It represents balance after a phase of imbalance a healthy step in any structural cycle.
3️⃣ Secondary Supply Zone (Resistance After Support)
Once the support holds, the price rallies back and retests the previous breakdown region.
This forms a secondary supply zone, where earlier buyers might book profits and short-term traders look for reaction.
It’s a retest phase, where the market decides whether it wants to continue upward or stay range-bound. A breakout from here indicates renewed strength, while rejection can invite another leg of consolidation or retracement.
4️⃣ New Structural Base (Fresh Support)
Recently, we can observe a new higher base forming just below the resistance zone.
This area acts as a structural pivot — often referred to by professionals as:
Intermediate Demand Zone
Base Formation Area
Mid-Structure Support
Higher Low Support Zone
Why This Cycle Matters--::
Recognizing this evolution from All-Time High → Correction → Support → Retest → New Structural Base helps traders identify where they are in the price cycle instead of reacting emotionally and It builds a roadmap of liquidity flow and institutional intent.
No matter the timeframe or assets like stocks, forex, or crypto this structure repeats endlessly, forming the core rhythm of the market.
Key Takeaway--::
Price doesn’t move randomly. It evolves through phases of enthusiasm, fear, and reaccumulation and every level leaves footprints of intent.
Traders who learn to read these transitions stop chasing moves and start understanding the underlying structure of opportunity.
Regards- Amit Rajan
Understanding the Market’s Natural Rhythm--::
Every chart tells a story a story of enthusiasm, correction, recovery, and retest.
Price action moves in cycles, and one of the most powerful yet simple cycles is when a market makes an All-Time High, corrects into a Support Zone, and then forms a New Resistance before deciding its next direction.
This NIFTY 50 weekly chart beautifully captures that structure a sequence every trader should recognize to understand market behavior with more clarity.
1️⃣ Major Swing High (The All-Time High)
At this stage, optimism dominates and new buyers rush in, assuming the trend will never end.
However, this is also where smart money begins distributing positions quietly.
You’ll often notice slowing momentum, smaller candle bodies, or divergence on oscillators.
This “All-Time High” is not just a price it’s the point where supply pressure starts building and emotional euphoria reaches its peak.
2️⃣ Primary Demand Zone (Support After the All-Time High)
As the correction begins, emotional traders exit while strong hands start building positions again.
The price eventually finds primary demand a zone that often aligns with previous breakout areas or major volume clusters.
This becomes a high-value area, where institutional accumulation quietly begins.
It represents balance after a phase of imbalance a healthy step in any structural cycle.
3️⃣ Secondary Supply Zone (Resistance After Support)
Once the support holds, the price rallies back and retests the previous breakdown region.
This forms a secondary supply zone, where earlier buyers might book profits and short-term traders look for reaction.
It’s a retest phase, where the market decides whether it wants to continue upward or stay range-bound. A breakout from here indicates renewed strength, while rejection can invite another leg of consolidation or retracement.
4️⃣ New Structural Base (Fresh Support)
Recently, we can observe a new higher base forming just below the resistance zone.
This area acts as a structural pivot — often referred to by professionals as:
Intermediate Demand Zone
Base Formation Area
Mid-Structure Support
Higher Low Support Zone
Why This Cycle Matters--::
Recognizing this evolution from All-Time High → Correction → Support → Retest → New Structural Base helps traders identify where they are in the price cycle instead of reacting emotionally and It builds a roadmap of liquidity flow and institutional intent.
No matter the timeframe or assets like stocks, forex, or crypto this structure repeats endlessly, forming the core rhythm of the market.
Key Takeaway--::
Price doesn’t move randomly. It evolves through phases of enthusiasm, fear, and reaccumulation and every level leaves footprints of intent.
Traders who learn to read these transitions stop chasing moves and start understanding the underlying structure of opportunity.
Regards- Amit Rajan
免責事項
この情報および投稿は、TradingViewが提供または推奨する金融、投資、トレード、その他のアドバイスや推奨を意図するものではなく、それらを構成するものでもありません。詳細は利用規約をご覧ください。
免責事項
この情報および投稿は、TradingViewが提供または推奨する金融、投資、トレード、その他のアドバイスや推奨を意図するものではなく、それらを構成するものでもありません。詳細は利用規約をご覧ください。