📈 NIFTY Trading Plan – 07-Apr-2025
Chart Reference: 15-Minute Timeframe
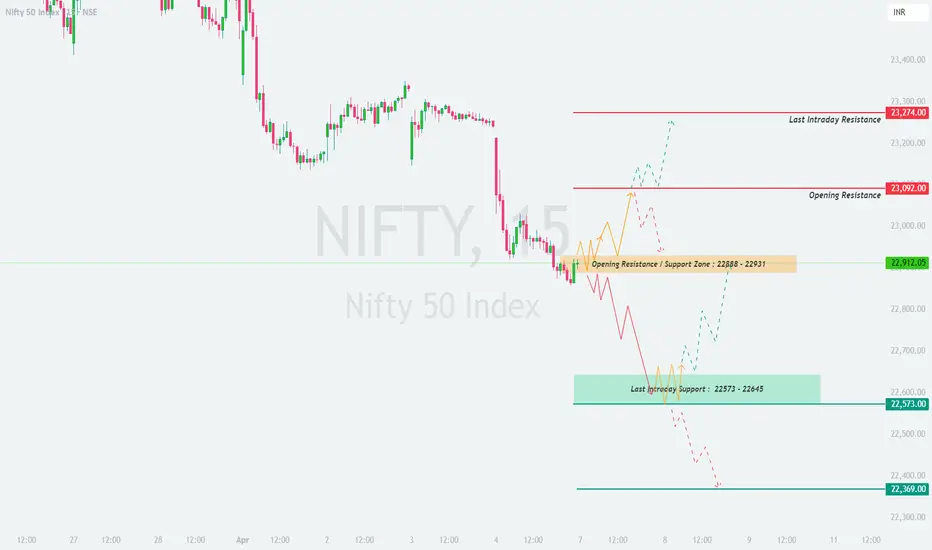
Previous Close: 22,912.05
Key Zones to Watch:
🟥 Opening Resistance Zone: 23,092
🟥 Last Intraday Resistance: 23,274
🟧 Opening Resistance/Support Zone: 22,888 – 22,931
🟩 Last Intraday Support Zone: 22,573 – 22,645
🟢 Support Below: 22,369
Let’s dive into each opening possibility with educational insights and actionable steps:
🔼 Scenario 1: Gap-Up Opening (100+ Points Above 23,092)
A gap-up above the Opening Resistance of 23,092 indicates bullish enthusiasm. However, the region around 23,274 marks a crucial Last Intraday Resistance, where supply could emerge.
📌 Plan of Action:
💡 Educational Insight:
Gap-ups often get sold into if not backed by strong follow-through buying. The region between 23,092 and 23,274 will act as a liquidity zone.
⚖️ Scenario 2: Flat Opening (Between 22,888 – 22,931 Zone)
A flat opening near the Opening Resistance/Support Zone (22,888 – 22,931) suggests indecision. This is a balance area, and price action will dictate the intraday trend.
📌 Plan of Action:
💡 Educational Insight:
When Nifty opens in a balance zone, the best trade usually forms after a breakout/rejection from that zone. Let the market show its hand first.
🔽 Scenario 3: Gap-Down Opening (100+ Points Below 22,888)
A gap-down opening below the support zone (22,888) reflects negative sentiment. The Last Intraday Support Zone (22,573 – 22,645) will be the key battlefield.
📌 Plan of Action:
💡 Educational Insight:
Gap-downs near strong support zones often result in short-covering rallies. Watch for reversal patterns like hammer or bullish engulfing candles on 15-min chart.
🛡️ Options Trading Risk Management Tips
📍 1. Avoid Overnight Positions in Weekly Expiry Zone: Theta decay and volatility can hurt your premium positions.
📍 2. Prefer Spread Strategies: Like bull call or bear put spreads to control risk.
📍 3. Use Defined Stop-Loss: Always keep SL based on candle close (15-min or hourly).
📍 4. Limit Position Sizing: Never risk more than 1-2% of your capital in a single trade.
📍 5. Avoid Trading Inside Range: When market is choppy between 22,888 – 23,092, stay light. Wait for confirmation.
🧾 Summary & Conclusion
📌 Key Resistance Levels:
🟥 23,092 → 23,274 → 23,370+
📌 Support Levels:
🟧 22,888 – 22,931
🟩 22,573 – 22,645
🟢 22,369
📌 Bias Based on Opening:
✅ Bullish Bias: Above 23,092, momentum toward 23,274 likely.
❌ Bearish Bias: Below 22,888, risk of fall toward 22,573 → 22,369.
⏸️ Neutral Zone: Inside 22,888 – 22,931, let market decide.
🎯 Stick to the plan, manage risk like a pro, and remember – patience is the best indicator!
⚠️ Disclaimer
I am not a SEBI-registered analyst. This analysis is purely for educational purposes only. Please do your own research or consult your financial advisor before taking any trade decisions.
Chart Reference: 15-Minute Timeframe
Previous Close: 22,912.05
Key Zones to Watch:
🟥 Opening Resistance Zone: 23,092
🟥 Last Intraday Resistance: 23,274
🟧 Opening Resistance/Support Zone: 22,888 – 22,931
🟩 Last Intraday Support Zone: 22,573 – 22,645
🟢 Support Below: 22,369
Let’s dive into each opening possibility with educational insights and actionable steps:
🔼 Scenario 1: Gap-Up Opening (100+ Points Above 23,092)
A gap-up above the Opening Resistance of 23,092 indicates bullish enthusiasm. However, the region around 23,274 marks a crucial Last Intraday Resistance, where supply could emerge.
📌 Plan of Action:
- [] Wait for price to sustain above 23,092 for 15–30 minutes with strong bullish candles and volume.
[] If sustained, consider long positions targeting 23,274. Book partial profits here.
[] A breakout above 23,274 may trigger a further upmove, but only if supported by volume. Targets could be 23,370+.
[] If Nifty opens above 23,092 but quickly drops below, it may trap longs. Wait for a retest before re-entering.
💡 Educational Insight:
Gap-ups often get sold into if not backed by strong follow-through buying. The region between 23,092 and 23,274 will act as a liquidity zone.
⚖️ Scenario 2: Flat Opening (Between 22,888 – 22,931 Zone)
A flat opening near the Opening Resistance/Support Zone (22,888 – 22,931) suggests indecision. This is a balance area, and price action will dictate the intraday trend.
📌 Plan of Action:
- [] Wait and watch the first 15-minute candle for clarity.
[] If Nifty breaks above 23,092 with strength, ride it toward 23,274.
[] If it slips below 22,888, the downside opens toward 22,645 → 22,573.
[] This zone is a No Trade Zone until a clear breakout or breakdown. Avoid early trades.
💡 Educational Insight:
When Nifty opens in a balance zone, the best trade usually forms after a breakout/rejection from that zone. Let the market show its hand first.
🔽 Scenario 3: Gap-Down Opening (100+ Points Below 22,888)
A gap-down opening below the support zone (22,888) reflects negative sentiment. The Last Intraday Support Zone (22,573 – 22,645) will be the key battlefield.
📌 Plan of Action:
- [] Observe if Nifty holds within the 22,573 – 22,645 area. If supported, expect a bounce back toward 22,888 – 22,931.
[] A breakdown below 22,573 opens the way toward 22,369.
[] Don’t chase shorts at open. Wait for a pullback toward 22,645 – 22,700 to initiate fresh positions with better risk-reward.
[] If price stabilizes around 22,573, scalping opportunities on both sides may appear.
💡 Educational Insight:
Gap-downs near strong support zones often result in short-covering rallies. Watch for reversal patterns like hammer or bullish engulfing candles on 15-min chart.
🛡️ Options Trading Risk Management Tips
📍 1. Avoid Overnight Positions in Weekly Expiry Zone: Theta decay and volatility can hurt your premium positions.
📍 2. Prefer Spread Strategies: Like bull call or bear put spreads to control risk.
📍 3. Use Defined Stop-Loss: Always keep SL based on candle close (15-min or hourly).
📍 4. Limit Position Sizing: Never risk more than 1-2% of your capital in a single trade.
📍 5. Avoid Trading Inside Range: When market is choppy between 22,888 – 23,092, stay light. Wait for confirmation.
🧾 Summary & Conclusion
📌 Key Resistance Levels:
🟥 23,092 → 23,274 → 23,370+
📌 Support Levels:
🟧 22,888 – 22,931
🟩 22,573 – 22,645
🟢 22,369
📌 Bias Based on Opening:
✅ Bullish Bias: Above 23,092, momentum toward 23,274 likely.
❌ Bearish Bias: Below 22,888, risk of fall toward 22,573 → 22,369.
⏸️ Neutral Zone: Inside 22,888 – 22,931, let market decide.
🎯 Stick to the plan, manage risk like a pro, and remember – patience is the best indicator!
⚠️ Disclaimer
I am not a SEBI-registered analyst. This analysis is purely for educational purposes only. Please do your own research or consult your financial advisor before taking any trade decisions.
免責事項
この情報および投稿は、TradingViewが提供または推奨する金融、投資、トレード、その他のアドバイスや推奨を意図するものではなく、それらを構成するものでもありません。詳細は利用規約をご覧ください。
免責事項
この情報および投稿は、TradingViewが提供または推奨する金融、投資、トレード、その他のアドバイスや推奨を意図するものではなく、それらを構成するものでもありません。詳細は利用規約をご覧ください。