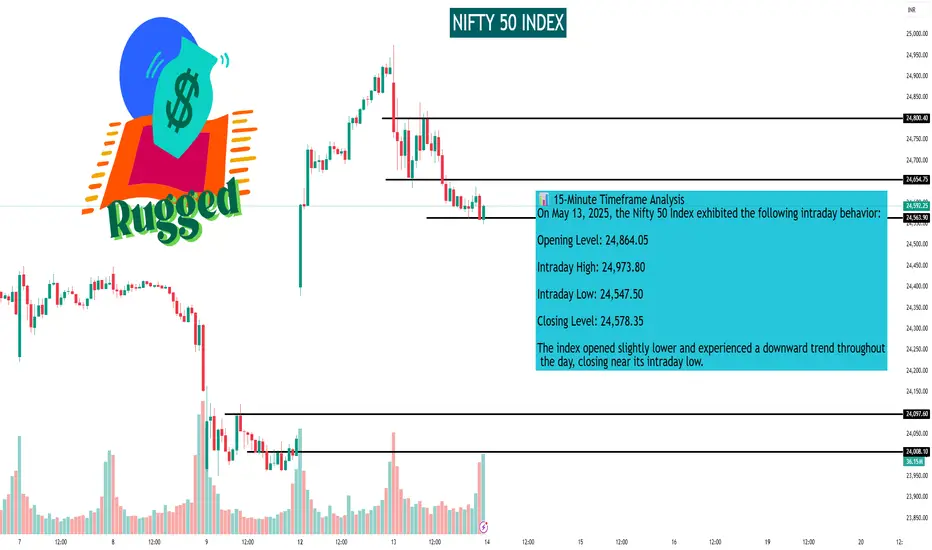
#NIFTY50 Analysis (15-min Chart)
Pattern: Breakdown from Ascending Trendline (bearish signal)
• Resistance:
• 24,700 - minor resistance
• 24,855 - swing high
• 25,066 - strong supply zone
• Support:
24,550 intraday support
24,400 strong demand zone
Note: Sustained trading below trendline weakens bullish momentum; watch for
bounce at 24,550 or reversal signs.
I built a Buy & Sell Signal Indicator with 85% accuracy.
📈 Get access via DM or
WhatsApp: wa.link/d997q0
| Email: techncialexpress@gmail.com
| Script Coder | Trader | Investor | From India
📈 Get access via DM or
WhatsApp: wa.link/d997q0
| Email: techncialexpress@gmail.com
| Script Coder | Trader | Investor | From India
関連の投稿
免責事項
これらの情報および投稿は、TradingViewが提供または保証する金融、投資、取引、またはその他の種類のアドバイスや推奨を意図したものではなく、またそのようなものでもありません。詳しくは利用規約をご覧ください。