IndiaVIX UP 9.01%. Volatility Increased in today's Session.
Analysis of recent trends in the NIFTY in respect of Put Call Ratio (PCR):
Latest PCR (OI) for Nifty: 1.02 (13-Oct-2025, market close)
Put Open Interest: 26,52,567
Call Open Interest: 25,94,255
Put OI Change: -2,85,365 (decrease)
Call OI Change: +5,06,005 (increase)
Intraday PCR Change: -0.56
Trend Analysis
PCR slightly above 1: Indicates a market position that is marginally bullish, as put OI is just above call OI, but not in extreme territory. This often means a neutral to moderately positive sentiment.
Recent Movement:
Put positions reduced (indicating some hedging is removed or traders expect less downside).
Call positions strongly increased (reflecting participants adding to bullish bets).
The intraday PCR delta is negative, suggesting a shift toward calls during today’s session, which sometimes precedes short-term tops or reversals if the sentiment gets too bullish.
Conclusion
Recent days show a shift from neutral/mildly bullish to slightly more aggressive positive sentiment.
If PCR dips below 1 or surges above 1.3 in coming days, that may indicate a market reversal or a strong trend continuation.
Keep monitoring PCR along with price action for confirmation of market direction.
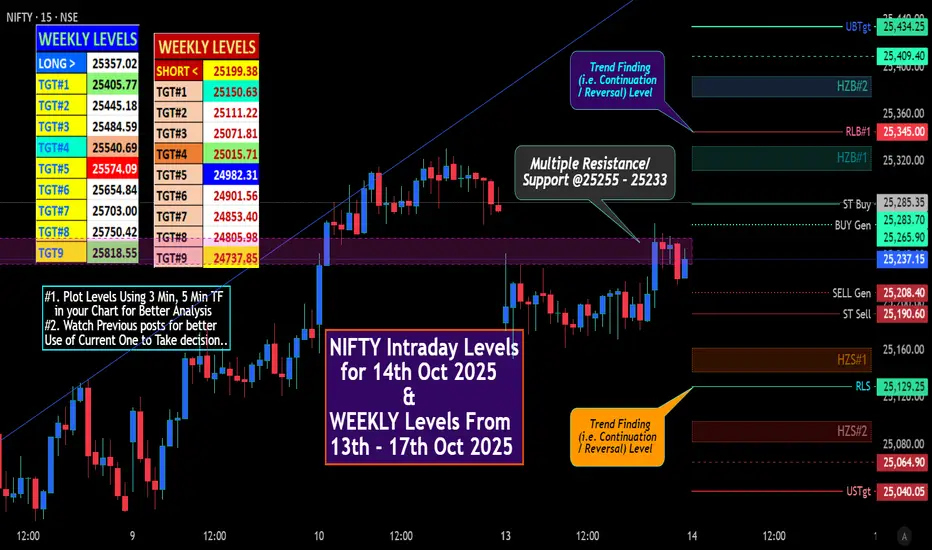
# "WEEKLY Levels" mentioned in BOX format.
^^^^^^^Plot Levels Using 3 Min, 5 Min Time frame in your Chart for Better Analysis^^^^^^^
L#1: If the candle crossed & stays above the “Buy Gen”, it is treated / considered as Bullish bias.
L#2: Possibility / Probability of REVERSAL near RLB#1 & UBTgt
L#3: If the candle stays above “Sell Gen” but below “Buy Gen”, it is treated / considered as Sidewise. Aggressive Traders can take Long position near “Sell Gen” either retesting or crossed from Below & vice-versa i.e. can take Short position near “Buy Gen” either retesting or crossed downward from Above.
L#4: If the candle crossed & stays below the “Sell Gen”, it is treated / considered a Bearish bias.
L#5: Possibility / Probability of REVERSAL near RLS#1 & USTgt
HZB (Buy side) & HZS (Sell side) => Hurdle Zone,
*** Specialty of “HZB#1, HZB#2 HZS#1 & HZS#2” is Sidewise (behaviour in Nature)
Rest Plotted and Mentioned on Chart
Color code Used:
Green =. Positive bias.
Red =. Negative bias.
RED in Between Green means Trend Finder / Momentum Change
/ CYCLE Change and Vice Versa.
Notice One thing: HOW LEVELS are Working.
Use any Momentum Indicator / Oscillatoror as you "USED to" to Take entry.
⚠️ DISCLAIMER:
The information, views, and ideas shared here are purely for educational and informational purposes only. They are not intended as investment advice or a recommendation to buy, sell, or hold any financial instruments. I am not a SEBI-registered financial adviser.
Trading and investing in the stock market involves risk, and you should do your own research and analysis. You are solely responsible for any decisions made based on this research.
"As HARD EARNED MONEY IS YOUR's, So DECISION SHOULD HAVE TO BE YOUR's".
Do comment if Helpful.
In depth Analysis will be added later
Analysis of recent trends in the NIFTY in respect of Put Call Ratio (PCR):
Latest PCR (OI) for Nifty: 1.02 (13-Oct-2025, market close)
Put Open Interest: 26,52,567
Call Open Interest: 25,94,255
Put OI Change: -2,85,365 (decrease)
Call OI Change: +5,06,005 (increase)
Intraday PCR Change: -0.56
Trend Analysis
PCR slightly above 1: Indicates a market position that is marginally bullish, as put OI is just above call OI, but not in extreme territory. This often means a neutral to moderately positive sentiment.
Recent Movement:
Put positions reduced (indicating some hedging is removed or traders expect less downside).
Call positions strongly increased (reflecting participants adding to bullish bets).
The intraday PCR delta is negative, suggesting a shift toward calls during today’s session, which sometimes precedes short-term tops or reversals if the sentiment gets too bullish.
Conclusion
Recent days show a shift from neutral/mildly bullish to slightly more aggressive positive sentiment.
If PCR dips below 1 or surges above 1.3 in coming days, that may indicate a market reversal or a strong trend continuation.
Keep monitoring PCR along with price action for confirmation of market direction.
# "WEEKLY Levels" mentioned in BOX format.
^^^^^^^Plot Levels Using 3 Min, 5 Min Time frame in your Chart for Better Analysis^^^^^^^
L#1: If the candle crossed & stays above the “Buy Gen”, it is treated / considered as Bullish bias.
L#2: Possibility / Probability of REVERSAL near RLB#1 & UBTgt
L#3: If the candle stays above “Sell Gen” but below “Buy Gen”, it is treated / considered as Sidewise. Aggressive Traders can take Long position near “Sell Gen” either retesting or crossed from Below & vice-versa i.e. can take Short position near “Buy Gen” either retesting or crossed downward from Above.
L#4: If the candle crossed & stays below the “Sell Gen”, it is treated / considered a Bearish bias.
L#5: Possibility / Probability of REVERSAL near RLS#1 & USTgt
HZB (Buy side) & HZS (Sell side) => Hurdle Zone,
*** Specialty of “HZB#1, HZB#2 HZS#1 & HZS#2” is Sidewise (behaviour in Nature)
Rest Plotted and Mentioned on Chart
Color code Used:
Green =. Positive bias.
Red =. Negative bias.
RED in Between Green means Trend Finder / Momentum Change
/ CYCLE Change and Vice Versa.
Notice One thing: HOW LEVELS are Working.
Use any Momentum Indicator / Oscillatoror as you "USED to" to Take entry.
⚠️ DISCLAIMER:
The information, views, and ideas shared here are purely for educational and informational purposes only. They are not intended as investment advice or a recommendation to buy, sell, or hold any financial instruments. I am not a SEBI-registered financial adviser.
Trading and investing in the stock market involves risk, and you should do your own research and analysis. You are solely responsible for any decisions made based on this research.
"As HARD EARNED MONEY IS YOUR's, So DECISION SHOULD HAVE TO BE YOUR's".
Do comment if Helpful.
In depth Analysis will be added later
トレード稼働中
Option Chain (28 Oct) Max Call OI at 25300. Max Put OI at 25200 / 25100. PCR (Put-Call Ratio) is near 1.0 (indicating a balanced but consolidation-prone market). 25200-25300 is the immediate battleground. Initial bias is slightly positive due to strong support at 25200.ノート
Probabilities for Day-End CloseFrom 25100:
Higher: 30% (DII support, US rebound).
Lower: 60% (weak cues, VIX spike emphasized).
Roughly Flat (±0.5%): 10% (expiry could stabilize).
Assumptions: Emphasizing VIX rally, negative headlines, and FII selling over DII buys; historical patterns in rising VIX days (70% downside) adjusted for sentiment.
関連の投稿
免責事項
これらの情報および投稿は、TradingViewが提供または保証する金融、投資、取引、またはその他の種類のアドバイスや推奨を意図したものではなく、またそのようなものでもありません。詳しくは利用規約をご覧ください。
関連の投稿
免責事項
これらの情報および投稿は、TradingViewが提供または保証する金融、投資、取引、またはその他の種類のアドバイスや推奨を意図したものではなく、またそのようなものでもありません。詳しくは利用規約をご覧ください。