[/b1. Overall Trend
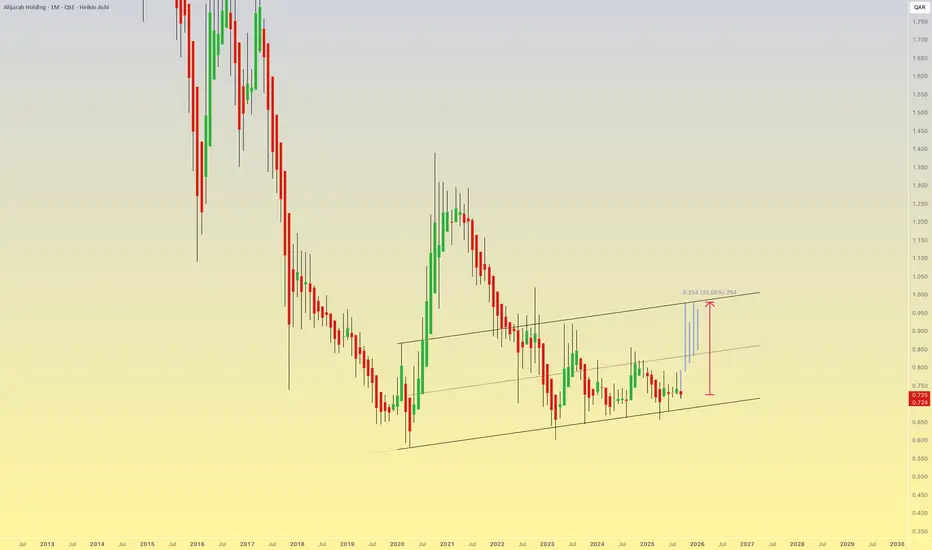
Since 2014, the stock has been in a long-term downtrend.
However, from around 2019 it started moving within an upward price channel (support and resistance trendlines).
2. Current Setup
Current price: QAR 0.724 (as of mid-September 2025).
The chart shows a clear ascending channel from 2019 onwards.
The stock is now approaching the upper boundary of the channel around 0.95–1.00 QAR.
Projection on the chart suggests ~35% potential upside if price moves toward the top of the channel.
3. Key Levels
Major Support: 0.65 – 0.68 QAR (lower channel boundary).
First Resistance: 0.85 QAR.
Second Resistance: 0.95 – 1.00 QAR (upper channel).
Breakout above 1.00 QAR could open the way toward 1.20 – 1.30 QAR, but that would require strong volume.
4. Technical Reading
Short- to medium-term bias: Positive, as long as price holds above 0.70 QAR.
Long-term bias: Still weak/neutral unless price breaks and sustains above 1.00 QAR.
The sideways movement inside the channel offers swing trading opportunities between support and resistance.
免責事項
これらの情報および投稿は、TradingViewが提供または保証する金融、投資、取引、またはその他の種類のアドバイスや推奨を意図したものではなく、またそのようなものでもありません。詳しくは利用規約をご覧ください。
免責事項
これらの情報および投稿は、TradingViewが提供または保証する金融、投資、取引、またはその他の種類のアドバイスや推奨を意図したものではなく、またそのようなものでもありません。詳しくは利用規約をご覧ください。