📊 Current Context
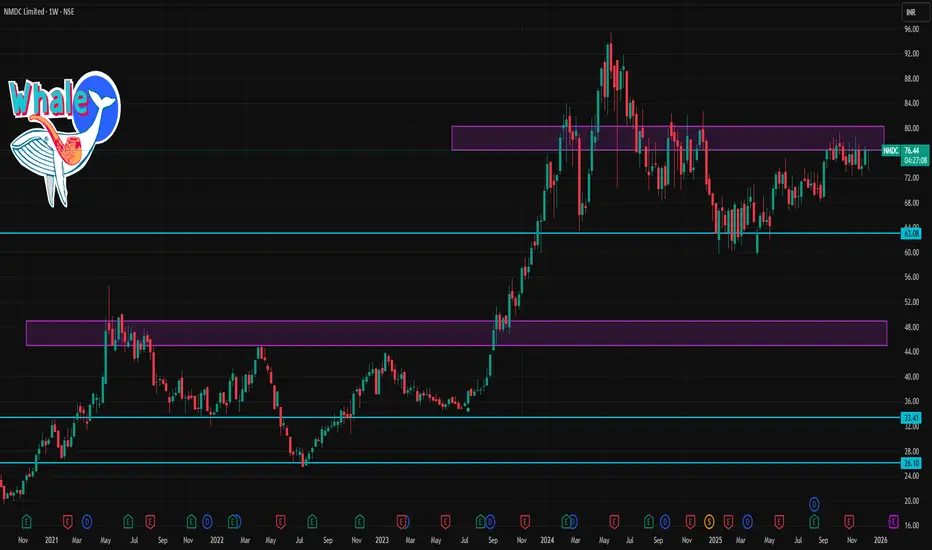
The stock is trading around ~₹74–76 recently.
🧠 Notes for the Week
Bullish scenario: Holding above ₹76 could support a move toward ₹78–80.
Bearish scenario: If price closes weekly below ₹73–72, short‑term downside may extend toward ₹71.
Pivot levels and Fibonacci retracements suggest the midpoint resistance ~₹75–76 is key for the next few sessions.
🔎 Quick Summary (1‑Week Levels)
Level Type Zone (Approx)
Strong Support ₹71–72
Immediate Support ₹73–74
Weekly Pivot ₹75.5–76
Immediate Resistance ₹76–77
Higher Resistance ₹78–79
Breakout Zone ₹80+
関連の投稿
免責事項
この情報および投稿は、TradingViewが提供または推奨する金融、投資、トレード、その他のアドバイスや推奨を意図するものではなく、それらを構成するものでもありません。詳細は利用規約をご覧ください。
関連の投稿
免責事項
この情報および投稿は、TradingViewが提供または推奨する金融、投資、トレード、その他のアドバイスや推奨を意図するものではなく、それらを構成するものでもありません。詳細は利用規約をご覧ください。