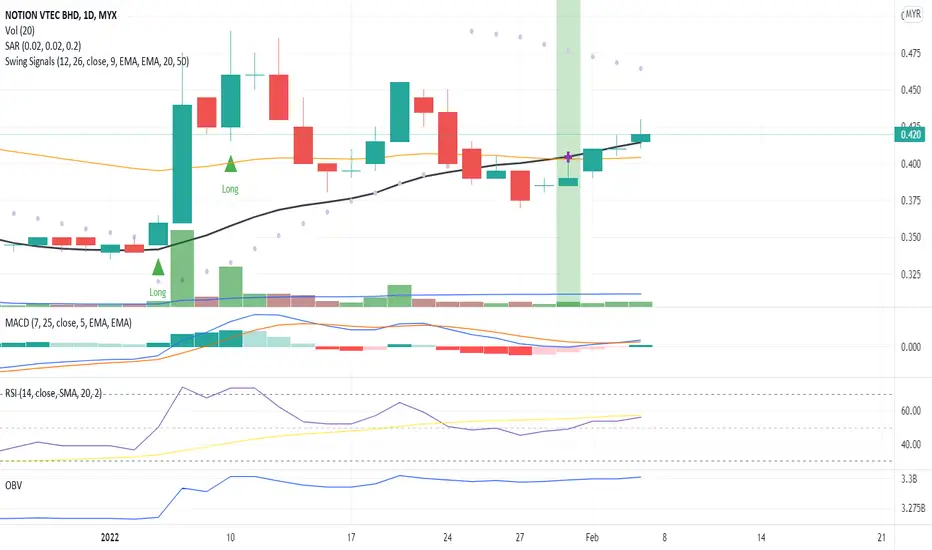
The candlestick body trend indicates an uptrend pattern where it closed above the MA20 line with volume below MA20.
The RSI is above 50 indicating a long-term uptrend momentum.
MACD and OBV indicate a divergence pattern, a beginning of an uptrend pattern.
Let's save NOTION to WL and watch out for significate price movement with volume where it continues the price momentum towards the next price resistance.
R 0.435
S 0.405
免責事項
この情報および投稿は、TradingViewが提供または推奨する金融、投資、トレード、その他のアドバイスや推奨を意図するものではなく、それらを構成するものでもありません。詳細は利用規約をご覧ください。
免責事項
この情報および投稿は、TradingViewが提供または推奨する金融、投資、トレード、その他のアドバイスや推奨を意図するものではなく、それらを構成するものでもありません。詳細は利用規約をご覧ください。