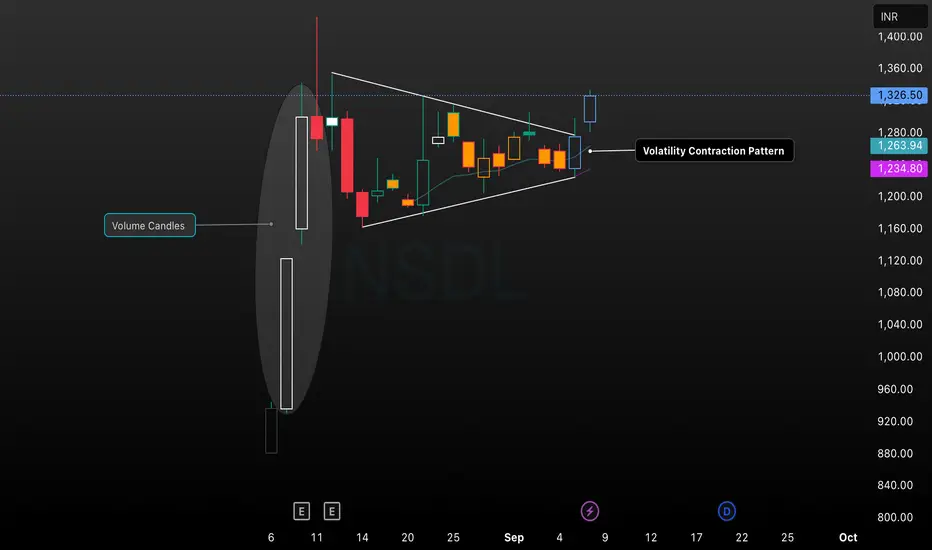
This chart displays the NSDL stock price on a daily timeframe, featuring a classic Volatility Contraction Pattern (VCP) after a surge in volume and price. The consolidation phase is marked by converging trendlines, with price contracting and forming tighter ranges. The recent breakout above the upper trendline signals renewed bullish momentum. Volume candles accentuate the initial surge, and key support/resistance levels are noted. This technical setup is ideal for traders seeking entries based on volatility contraction and breakout strategies.
免責事項
これらの情報および投稿は、TradingViewが提供または保証する金融、投資、取引、またはその他の種類のアドバイスや推奨を意図したものではなく、またそのようなものでもありません。詳しくは利用規約をご覧ください。
免責事項
これらの情報および投稿は、TradingViewが提供または保証する金融、投資、取引、またはその他の種類のアドバイスや推奨を意図したものではなく、またそのようなものでもありません。詳しくは利用規約をご覧ください。